Immediate drawing mode vs path drawing mode
IMMEDIATE MODE = EXECUTING A CALL TO A DRAWING METHOD MEANS IMMEDIATELY DRAWING IN THE CANVAS
In the previous examples, we saw how to draw some rectangles using the fillRect(x, y, width, height)and strokeRect(x, y, width, height) methods of the context.
We also learned how to draw a text message using the fillText(message, x, y) and strokeText(message, x, y) methods that draws a text in filled and wireframe mode, respectively.
These methods, along with the drawImage(...) method already seen in section 3.3.3, are "immediate methods": as soon as they are executed, the results are displayed on screen, the drawings are performed, pixels on the canvas area change their colors, etc.
Here is a code extract that will draw 1000 random rectangles in a canvas, using immediate mode rectangle drawing calls.
Online example: http://jsbin.com/zanizu/3/edit
- var canvas, ctx, w, h;
- function init() {
- canvas = document.getElementById('myCanvas');
- ctx = canvas.getContext('2d');
- w = canvas.width;
- h = canvas.height;
- console.time("time to draw");
- for(var i=0; i < 1000; i++) {
- var x = Math.random() * w;
- var y = Math.random() * h;
- var width = Math.random() * w;
- var height = Math.random() * h;
- ctx.strokeRect(x, y, width, height);
- }
- console.timeEnd("time to draw");
- }
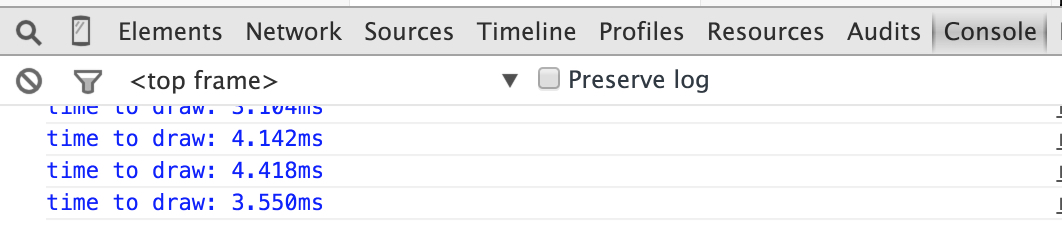
Lines 12-18 draw 1000 rectangles of random sizes in immediate mode. We also measure the time using the usual console.time(name_of_timer) and console.timeEnd(name_of_timer) that will write in the browser console the time elapsed. Note that console.time(...) and console.timeEnd(...) display results only in the browser's console, not in the JS Bin console.
On a Mac Book Pro from 2015, the result is:
PATH MODE = FILL A BUFFER THEN EXECUTE ALL BUFFERED ORDERS AT ONCE TO ENABLE OPTIMIZATION AND PARALLELISM
There is another drawing mode called "path drawing mode" where you first send drawing orders to the graphics processor, and these orders are stored in a buffer. Then you call methods to draw the whole buffer at once. There are also methods to erase the buffer's content.
Path drawing mode allows parallelism: if you need to draw 10.000 rectangles, it's better to store the orders in the graphics card, then execute the drawing all at once, rather than doing 10.000 immediate calls tostrokeRect(...) for example. With the buffered mode, the Graphic Processing Unit (GPU) of the graphics card hardware will be able to parallelize the computations (modern graphics cards can execute hundreds/thousands of things in parallel).
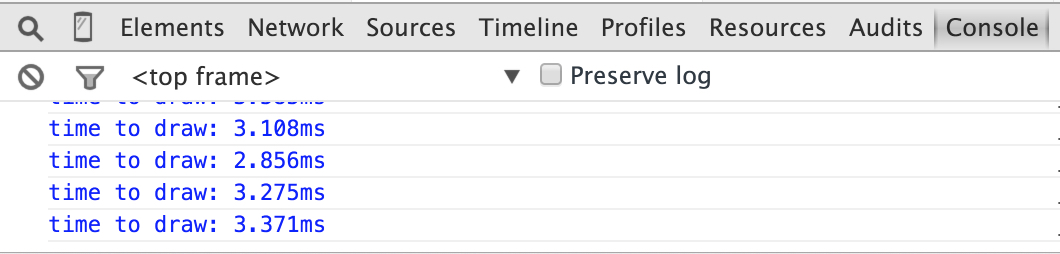
Same example as before, this time using the buffered mode for drawing rectangles: http://jsbin.com/zanizu/5/edit
Extract from source code (the part that draws the rectangles):
- for(var i=0; i < 1000; i++) {
- var x = Math.random() * w;
- var y = Math.random() * h;
- var width = Math.random() * w;
- var height = Math.random() * h;
- ctx.rect(x, y, width, height); // store a rectangle in path/buffer
- }
- ctx.stroke(); // draws the whole buffer (the 1000 rectangles) at once
Instead of calling strokeRect(...) or fillRect(...), we just call the rect(...) method of the context (line 7). This is how we can delay the drawing of the rectangles. The 1000 rectangles are stored in a buffer in the hardware.
The call to ctx.stroke() (line 9) or to its sister method ctx.fill() will draw the entire buffer contents in fill or stroke mode.
And here is what the timer gives: a slightly faster execution time. Changing 1000 to 100.000 will give even larger differences.
Path mode is faster than immediate mode!
RESET THE PATH MODE BUFFER
A call to ctx.beginPath() will reset the buffer (empty its contents). We will see many more examples of using the Path drawing mode in another section later on this week.
- // start a new buffer / path
- ctx.beginPath();
- // all these orders are in a buffer/path
- ctx.moveTo(10, 10);
- ctx.lineTo(100, 100);
- ctx.lineTo(150, 70);
- // Draw the buffer
- ctx.stroke();
SUMMARY OF PATH MODE PRINCIPLES
- Call drawing methods that work in path mode, for example call ctx.rect(...) instead ofctx.strokeRect(...) or ctx.fillRect(...)
- Call ctx.stroke() or ctx.fill() to draw the buffer's contents,
- Beware that the buffer is never emptied, two consecutive calls to ctx.stroke() will draw the buffer contents twice! Instead, use ctx.beginPath() to empty it if needed.
- It is possible to empty the buffer by calling ctx.beginPath().
- Path drawing is faster than immediate drawing (parallelization is possible).
Path drawing: lines
INTRODUCTION
We have been drawing rectangles so far.Let's go a bit further now by introducing the notion of "path drawing". This approach consists in using thectx.moveTo(x, y) method of the context, in conjunction with other drawing methods that end in "To", such as ctx.lineTo(x, y).This makes drawing multiple connected lines easier. Consecutive calls to ctx.lineTo(x, y) will store in the path/buffer a set of connected lines that we will draw altogether by a single call to ctx.stroke() orctx.fill().Here are the different steps:- Put the "pencil" somewhere with a call to ctx.moveTo(x1, y1). This will be the origin of the first line.
- Call the ctx.lineTo(x2, y2) method to draw a line from the previous position (previous step) to the position passed as parameters to the lineTo(...) method. This position will serve as the origin for the next line to be drawn.
- Call lineTo(x3, y3) again to draw a line that goes from (x2, y2) to (x3, y3). This line will start at the end of the previous one.
- Repeat step 3 to draw more connected lines.
- Call the ctx.stroke() or the ctx.fill() methods to draw the path defined by the different lines.
Note that the call to ctx.stroke() or ctx.fill() will use the current values of the strokeStyle orfillStyle properties. It is possible to call ctx.moveTo(x, y) in the middle of steps 1 through 5 in order to move the pen somewhere else without connecting to the last drawn line.Here is an example that draws a grid: http://jsbin.com/zugale/1/edit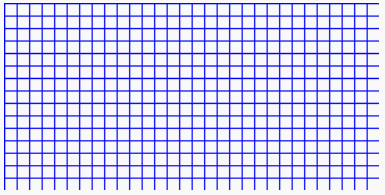
- var canvas=document.getElementById('myCanvas');
- var ctx=canvas.getContext('2d');
- // Vertical lines
- for (var x = 0.5; x < 500; x += 10) {
- ctx.moveTo(x, 0);
- ctx.lineTo(x, 375);
- }
- // Horizontal lines
- for (var y = 0.5; y < 375; y += 10) {
- ctx.moveTo(0, y);
- ctx.lineTo(500, y);
- }
- // Draw in blue
- ctx.strokeStyle = "#0000FF";
- // Before the execution of the next line nothing as been drawn yet !
- ctx.stroke();
In this example, the entire grid is drawn during the execution of the last line of code, with the single call toctx.stroke().ANOTHER EXAMPLE MIXING FILLED AND WIREFRAME SHAPES (AND IMMEDIATE AND PATH MODES)
Try this interactive example here: http://jsbin.com/zetupi/4/edit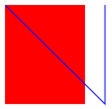
- var canvas=document.getElementById('myCanvas');
- var ctx=canvas.getContext('2d');
- // a filled rectangle in immediate mode
- ctx.fillStyle='#FF0000';
- ctx.fillRect(0,0,80,100);
- // two consecutive lines in path mode
- ctx.moveTo(0,0);
- ctx.lineTo(100, 100);
- ctx.lineTo(100,0);
- // draws only the two lines in wireframe mode
- ctx.strokeStyle = "#0000FF";
- ctx.stroke();
This example shows that filled and wireframe shapes should be drawn differently (here a filled rectangle is drawn using a call to the fillRect(...) method while a wireframe set of connected lines is drawn using thestroke() method of the context).DRAWING A SINGLE PATH MADE WITH DISCONNECTED LINES / PARTS
Try this interactive example here: http://jsbin.com/lefoze/2/edit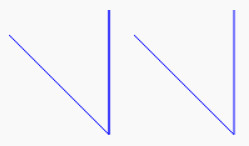
- var canvas=document.getElementById('myCanvas');
- var ctx=canvas.getContext('2d');
- // first part of the path
- ctx.moveTo(20,20);
- ctx.lineTo(100, 100);
- ctx.lineTo(100,0);
- // second part of the path, moveTo(...) is used to "jump" to another place
- ctx.moveTo(120,20);
- ctx.lineTo(200, 100);
- ctx.lineTo(200,0);
- // indicate stroke color + draw the path
- ctx.strokeStyle = "#0000FF";
- ctx.stroke();
In this example, we simply called the moveTo() method between each part of the path. And we calledstroke() only once to draw the whole path.
Drawing lines with different styles
COMMON MISTAKE: DRAWING THE SAME PATH TWICE
Let's look at the drawing from the last example of the previous section:
Imagine that we would like to draw them with different styles and colors: the shape on the left will stay as it is now (blue, wireframe), while the second shape on the right will be filled, colored in pink. Let's look at how we can do this...
DRAWING TWO PATHS WITH DIFFERENT STYLES, THE WRONG AND THE GOOD WAY!
First, the wrong way!
In this example, we will draw the two parts of the path with different styles: the first part in wireframe mode, and the second part in filled mode.
What we will try first is to call stroke() after the first half of the path, then call fill() after the second half of the path (check this interactive example):
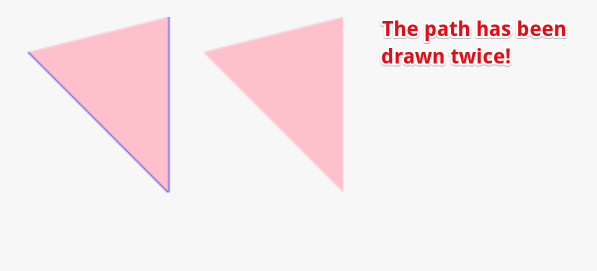
Here is the code:
- var canvas=document.getElementById('myCanvas');
- var ctx=canvas.getContext('2d');
- // first part of the path
- ctx.moveTo(20,20);
- ctx.lineTo(100, 100);
- ctx.lineTo(100,0);
- // indicate stroke color + draw first part of the path
- ctx.strokeStyle = "#0000FF";
- ctx.stroke();
- // second part of the path
- ctx.moveTo(120,20);
- ctx.lineTo(200, 100);
- ctx.lineTo(200,0);
- // indicate stroke color + draw the path
- ctx.fillStyle = "pink";
- ctx.fill();
Hey - it does not work! Weirdly, the two parts of the path are filled in pink! But we called stroke() after the first half of the path was drawn (lines 5-8). Then we called fill() only after the second part of the path was specified (lines 14-19)... so, what happened?
Remember that fill() or stroke() draws the whole path, even if it is disconnected, and even if it has already been drawn!
What happened is:
- The call to stroke() has drawn the path corresponding to the lines 5-7. Indeed, the first part of the path (on the left) has actually been drawn once in wireframe mode, and in blue.
- Then, the call to fill() at line 20 has drawn the whole path again, but in pink and in filled mode. But this time the path corresponds to lines 5-7 plus lines 14-16 that make up the second shape on the right. So the path that has been drawn this time is made of both of the triangles.
Important: If you do not want to draw parts of the same path several times, you need to draw two different paths, using the ctx.beginPath() method, as shown in the next example.
Now, the right way!
Online example: http://jsbin.com/niceqo/2/edit
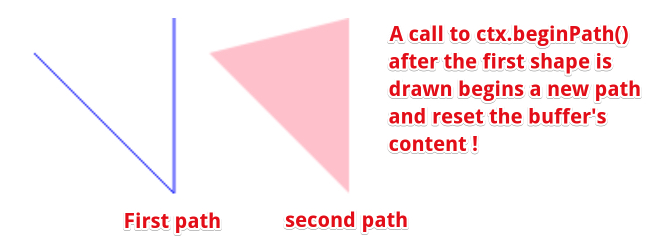
Source code:
- var canvas=document.getElementById('myCanvas');
- var ctx=canvas.getContext('2d');
- // first part of the path
- ctx.moveTo(20,20);
- ctx.lineTo(100, 100);
- ctx.lineTo(100,0);
- // indicate stroke color + draw first part of the path
- ctx.strokeStyle = "#0000FF";
- ctx.stroke();
- // start a new path, empty the current buffer
- ctx.beginPath();
- // second part of the path
- ctx.moveTo(120,20);
- ctx.lineTo(200, 100);
- ctx.lineTo(200,0);
- // indicate stroke color + draw the path
- ctx.fillStyle = "pink";
- ctx.fill();
This time, in order to draw the two shapes differently, we defined two separate paths. The way to do this is just to call ctx.beginPath() to start a new path. In this example, the first path has been drawn in wireframe mode, then a new path has been started that is drawn in filled mode.
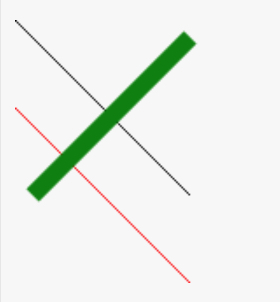
Drawing lines in immediate mode
Sometimes it might be useful to draw just one line without being in another path.
It's interesting to see how we can write a single "draw line" function that takes the start and end coordinates, the color, the line width, etc.
Here is the code:
- function drawLine(x1, y1, x2, y2, color, width) {
- ctx.save();
- // set color and lineWidth, if these parameters
- // are not defined, do nothing (default values)
- if(color)
- ctx.strokeStyle = color;
- if(width)
- ctx.lineWidth = width;
- // start a new path
- ctx.beginPath();
- ctx.moveTo(x1, y1);
- ctx.lineTo(x2, y2);
- ctx.stroke();
- ctx.restore();
- }
Notice the save/restore of the context at the beginning/end of the function. This is REALLY a good practice to avoid affecting other functions' context.
- Line 13 starts a new path so that the function will only draw what it is meant to draw: a single line.
- Lines 15-17 move the "pen" at (x1, y1) then draw a line to (x2, y2), and the stroke at line 17 makes it appear on the screen.
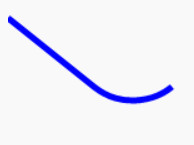
Here is an example (see online example):
- drawLine(0, 0, 100, 100);
- drawLine(0, 50, 150, 200, 'red');
- drawLine(10, 100, 100, 10, 'green', 10);
Result:
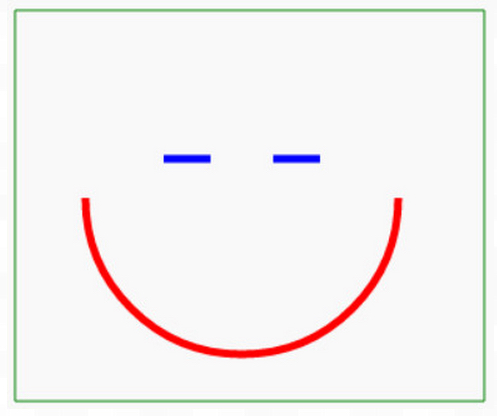
Practical example: drawing arrows
In this section, we present a function that draws arrows in a canvas, such as in the illustration below:
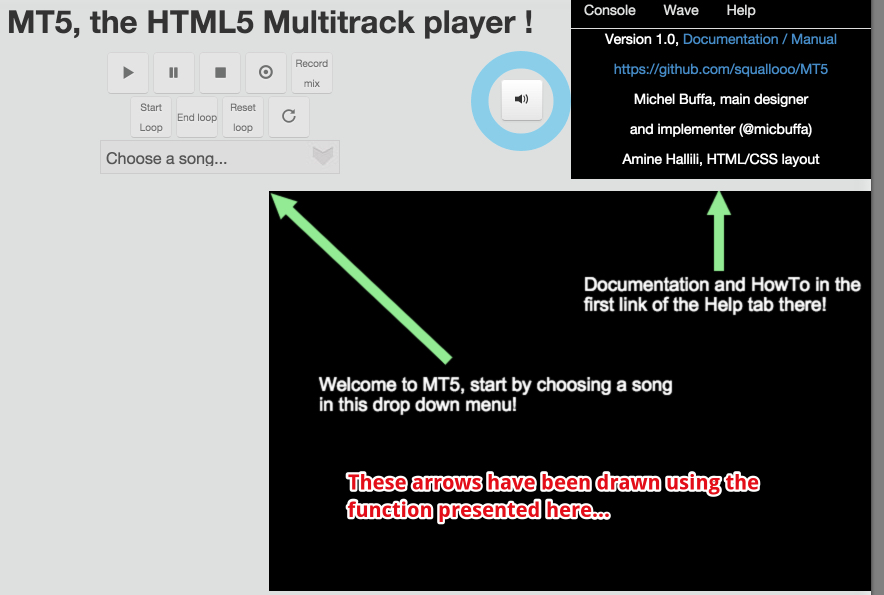
You might find multiple implementations on the Web for drawing arrows in a canvas, but the one we are presenting has the advantage of being rather simple and has the possibility to set the color and line width of the arrows.
Let's see some examples of use:
- // Adapted from : http://stackoverflow.com/questions/808826/draw-arrow-on-canvas-tag
- function drawArrow(ctx, fromx, fromy, tox, toy, arrowWidth, color){
- //variables to be used when creating the arrow
- var headlen = 10;
- var angle = Math.atan2(toy-fromy,tox-fromx);
- ctx.save();
- ctx.strokeStyle = color;
- //starting path of the arrow from the start square to the end square
- //and drawing the stroke
- ctx.beginPath();
- ctx.moveTo(fromx, fromy);
- ctx.lineTo(tox, toy);
- ctx.lineWidth = arrowWidth;
- ctx.stroke();
- //starting a new path from the head of the arrow to one of the sides of
- //the point
- ctx.beginPath();
- ctx.moveTo(tox, toy);
- ctx.lineTo(tox-headlen*Math.cos(angle-Math.PI/7),
- toy-headlen*Math.sin(angle-Math.PI/7));
- //path from the side point of the arrow, to the other side point
- ctx.lineTo(tox-headlen*Math.cos(angle+Math.PI/7),
- toy-headlen*Math.sin(angle+Math.PI/7));
- //path from the side point back to the tip of the arrow, and then
- //again to the opposite side point
- ctx.lineTo(tox, toy);
- ctx.lineTo(tox-headlen*Math.cos(angle-Math.PI/7),
- toy-headlen*Math.sin(angle-Math.PI/7));
- //draws the paths created above
- ctx.stroke();
- ctx.restore();
- }
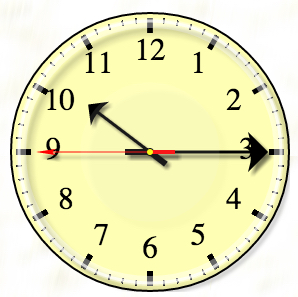
An arrow is made of one line (the arrow body) and three connected lines (the arrow head).
As we modify some context properties in that function, we call save() and restore() at the beginning and at the end of the function.
This function can be improved in many ways: adding shadows, using fill() instead of stroke(), which gives strange results when the width is too big, etc.
EXAMPLES
Online example that uses the above code: http://jsbin.com/qekuqotumu/1/edit
- drawArrow(ctx, 10, 10, 100, 100, 10, 'red');
- drawArrow(ctx, 100, 10, 140, 140, 3, 'black');
Result:
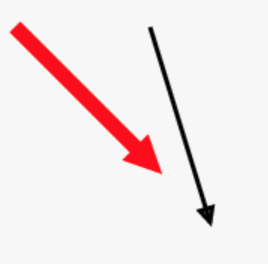
DRAW NICER ARROWS?
On the Web, you will find many different ways to draw arrows.
This Web site is worth reading: http://www.dbp-consulting.com/tutorials/canvas/CanvasArrow.html. It details how to draw arrows with curved heads and different styles for the head. Note however that you will need to modify some parts if you want it to support different line widths, etc.
Screenshot from a demo available on the above Web site:
In a next part of the course dedicated to curve drawing in a canvas, we will also show how to draw curved arrows, with very simple code (much simpler than the one used for drawing the clock's arrows above).
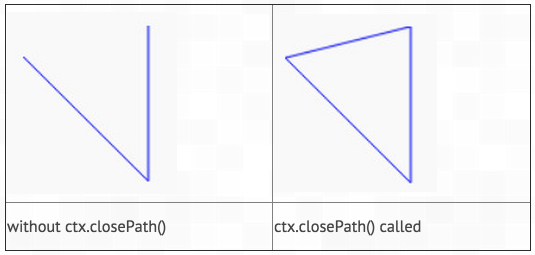
Closing a path
The ctx.closePath() method indicates that we would like a closed path: draw from the last point to the first one.
Try this interactive example: http://jsbin.com/jocina/1/edit
Source code:
- var canvas=document.getElementById('myCanvas');
- var ctx=canvas.getContext('2d');
- // Path made of three points (defines two lines)
- ctx.moveTo(20,20);
- ctx.lineTo(100, 100);
- ctx.lineTo(100,0);
- // Close the path, try commenting this line
- ctx.closePath();
- // indicate stroke color + draw first part of the path
- ctx.strokeStyle = "blue";
- ctx.stroke();
- Lines 5-7 corresponds to a path made of two consecutive lines. If we just call stroke() after that, two lines will be drawn on the canvas.
- Line 10 indicates that we would like a closed path. In that case, the call to stroke() at line 14 will draw the two lines plus an extra line that connects the last point of the path to the first one. It will draw a closed triangle!
Try commenting the line in the online example and see the results!
Drawing circles and arcs
The ctx.arc(cx, cy, radius, startAngle, endAngle, drawInverse) method is useful for drawing arcs of circles. It takes the center of the circle/arc, its radius, the starting angle of the arc (turning clockwise), the ending angle of the arc, and an optional parameter we will talk about later.
Note: figures borrowed from http://www.html5canvastutorials.com/tutorials/html5-canvas-arcs/
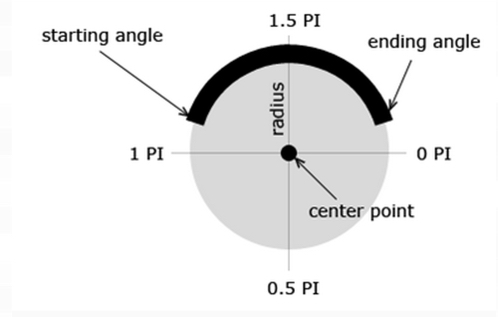
TYPICAL USAGE
Typical usage for drawing an arc/circle/ellipse is:
- ctx.arc(centerX, centerY, radius, startAngle, endAngle); // clockwise drawing
- ctx.arc(centerX, centerY, radius, startAngle, endAngle, false);
The angles are in radians (between 0 and 2*Math.PI). The arc is drawn clockwise. Beware that this may not seem natural if you're used to the trigonometric order.
The last parameter is optional and has a value of false by default. If true, instead of drawing an arc of circle that corresponds to the parameters, it will draw its complementary. See the examples below to see the difference.
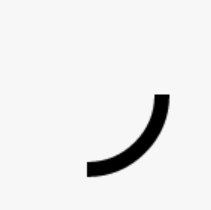
EXAMPLE 1: DRAWING AN ARC WITH RADIUS = 50, STARTING ANGLE = 0, END ANGLE = PI/2
Try this example online: http://jsbin.com/tikite/1/edit
- ctx.beginPath();
- // we ommited the last parameter
- ctx.arc(100, 75, 50, 0, Math.PI/2);
- ctx.lineWidth = 10;
- ctx.stroke();
Here is the result:
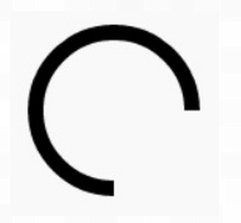
If we change the last parameter (we omitted it, so it took a value of false by default):
- ctx.beginPath();
- // we ommited the last parameter
- ctx.arc(100, 75, 50, 0, Math.PI/2, true);
- ctx.lineWidth = 10;
- ctx.stroke();
Then, the result is the "complementary" of the previous arc:
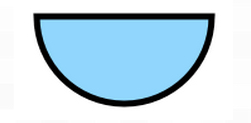
EXAMPLE 2: DRAWING A FULL CIRCLE (FILLED + OUTLINED)
Try this example: http://jsbin.com/gazuba/2/edit
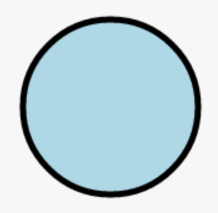
Source code:
- var canvas = document.getElementById("myCanvas");
- var ctx = canvas.getContext("2d");
- var centerX = canvas.width / 2;
- var centerY = canvas.height / 2;
- var radius = 70;
- ctx.beginPath();
- // Add to the path a full circle (from 0 to 2PI)
- ctx.arc(centerX, centerY, radius, 0, 2*Math.PI, false);
- // With path drawing you can change the context
- // properties until a call to stroke() or fill() is performed
- ctx.fillStyle = "lightBlue";
- // Draws the filled circle in light blue
- ctx.fill();
- // Prepare for the outline
- ctx.lineWidth = 5;
- ctx.strokeStyle = "black";
- // draws AGAIN the path (the circle), this
- // time in wireframe
- ctx.stroke();
- // Notice we called ctx.arc() only once ! And drew it twice
- // with different styles
Notice that we called ctx.arc() only once! And drew it twice, with different styles, with calls to ctx.stroke()and ctx.fill(). Each call drew the defined path in wireframe and in filled mode!
PROPOSED PROJECTS
Project 1 - modify the previous example on http://jsbin.com/gazuba/2/edit in order to get:
Project 2 - make a small program that draws a smiling head like that (or make something better!)
Drawing rounded rectangles: the arcTo(x1, y1, x2, y2, radius) method
INTRODUCTION
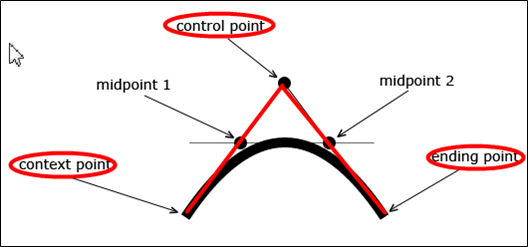
There is another method called ctx.arcTo(x1, y1, x2, y2, radius), which is a bit complex to use, but very practical for drawing rounded rectangles.
In fact, the arcTo(...) method draws an arc of a circle depending on some tangents. Let's look at these pictures for a better understanding (original picture from http://www.dbp-consulting.com/tutorials/canvas/CanvasArcTo.html):
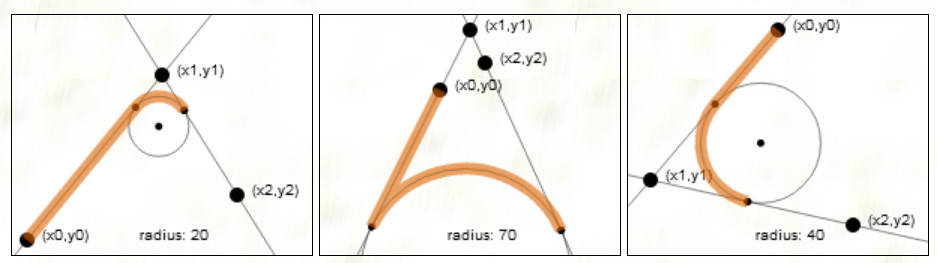
TYPICAL USE
- ctx.moveTo(x0, y0);
- ctx.arcTo(x1, y1, x2, y2, radius);
This method can be confusing. It was defined mainly for drawing rounded shapes like rounded rectangles. We used an excerpt here from the excellent tutorial on the arcTo(...) method available at http://www.dbp-consulting.com/tutorials/canvas/CanvasArcTo.html.
It works like this:
- Draw an imaginary line through (x0,y0) and (x1,y1), draw another imaginary line through (x1,y1) and(x2,y2),
- Take an imaginary circle of radius r, and slide it up between the two lines until it just touches both lines. The two points at which the circle touches the lines are called the tangent points.
- arcTo(x1, y1, x2, y2, r) will draw a line from the current point (x0,y0) to the first tangent point on the line from (x0,y0) to (x1,y1),
- It will also draw an arc from that tangent point to the other tangent point on the line from (x1,y1) to(x2,y2) along the circumference of the circle.
- Finally, it adds the tangent point where the arc ends up, on the line from (x1,y1) to (x2,y2) to the path as the new current point on the path.
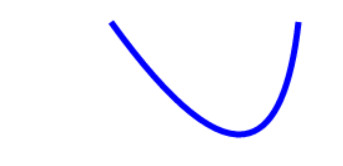
EXAMPLE 1: SIMPLE USE
Try this interactive example: http://jsbin.com/bocomu/1/edit
- context.beginPath();
- context.moveTo(0, 20);
- context.arcTo(100, 100, 200, 20, 50);
- context.lineWidth = 5;
- context.strokeStyle = "#0000ff";
- context.stroke();
EXAMPLE 2: DRAW A ROUNDED RECTANGLE
Try this interactive example here: http://jsbin.com/kuqalu/1/edit
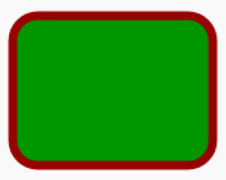
Source code:
- var roundedRect=function(ctx,x,y,width,height,radius,fill,stroke) {
- ctx.beginPath();
- // draw top and top right corner
- ctx.moveTo(x+radius,y);
- ctx.arcTo(x+width,y,x+width,y+radius,radius);
- // draw right side and bottom right corner
- ctx.arcTo(x+width,y+height,x+width-radius,y+height,radius);
- // draw bottom and bottom left corner
- ctx.arcTo(x,y+height,x,y+height-radius,radius);
- // draw left and top left corner
- ctx.arcTo(x,y,x+radius,y,radius);
- if(fill) {
- ctx.fill();
- }
- if(stroke){
- ctx.stroke();
- }
- }
- var canvas = document.getElementById('myCanvas');
- var ctx = canvas.getContext('2d');
- ctx.strokeStyle = 'rgb(150,0,0)';
- ctx.fillStyle = 'rgb(0,150,0)';
- ctx.lineWidth = 7;
- roundedRect(ctx, 15, 15, 160, 120, 20, true, true);
In this example, each call to ctx.arcTo(...) draws a side plus a corner. This makes us suspect that thearcTo() method has been designed primarily for drawing rounded rectangles...
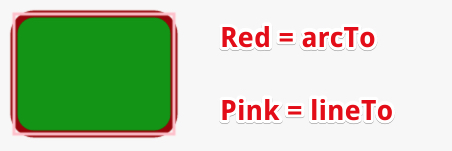
EXAMPLE 3 COMPARISON BETWEEN LINETO AND ARCTO
This example at JS Bin is the same as the previous one, except that we added at the end of the roundedRect function the same lines of code that draw the rounded rectangle, but using lineTo instead of arcTo. Just give it a look!
Quadratic curves
INTRODUCTION
Quadratic curves are defined by a starting point (called a "context point"), a control point, and an ending point. The curve fits the tangents between the context and control points and between the control and ending points.
The context point may be defined by a call to the moveTo(x, y) method of the context, or it may be the ending point of a previous path, if we're drawing a path made of several shapes. For example, drawing a line and a quadratic curve will make the endpoint of the line the context point for the quadratic curve.
The control point controls the curvature - if we move the control point farther we get a sharper curve.
TYPICAL USE
- context.moveTo(contextX, contextY);
- context.quadraticCurveTo(controlX, controlY, endX, endY);
- // Optional : set lineWidth and stroke color
- context.lineWidth = 5;
- context.strokeStyle = "#0000ff";
- // Draw!
- context.stroke();
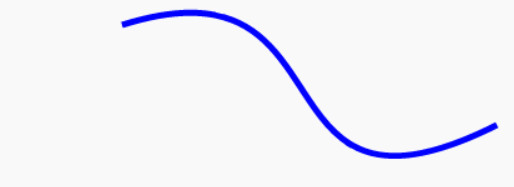
EXAMPLE 1: QUADRATIC CURVE
Try this interactive example here: http://jsbin.com/vefivu/1/edit
Source code:
- var canvas=document.querySelector('#myCanvas1');
- var context=canvas.getContext('2d');
- context.beginPath();
- context.moveTo(100, 20);
- context.quadraticCurveTo(230, 200, 250, 20);
- context.lineWidth = 5;
- context.strokeStyle = "#0000ff";
- context.stroke();
We set a starting point in line 6: moveTo(...), then set the control and ending points with a call toquadraticCurve(...), at line 7, then set some properties for color, thickness, and finally we call thestroke() method for drawing the curve.
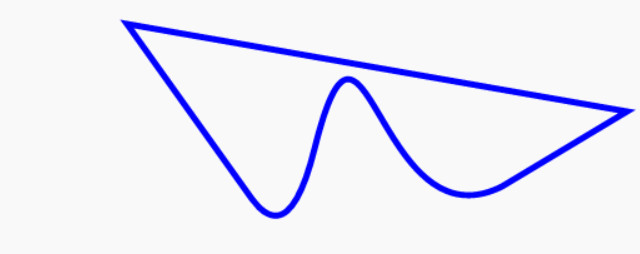
EXAMPLE 2: LINES CONNECTED WITH A QUADRATIC CURVE
Try this interactive example here: http://jsbin.com/sibuse/1/edit
Source code:
- context.beginPath();
- context.moveTo(100, 20);
- context.lineTo(200, 80);
- context.quadraticCurveTo(230, 200, 250, 20);
- context.lineTo(500, 90);
- context.lineWidth = 5;
- context.strokeStyle = "#0000ff";
- context.stroke();
Practical example: use quadratics for drawing curved arrows
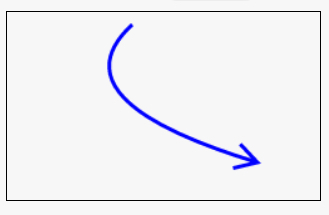
Online example: http://jsbin.com/xaraqo/3/edit
We propose a useful function for drawing curved arrows. The code is a modified version of what has been proposed by several contributors to this thread at StackOverflow.
Source code of the function that draws a curved arrow:
- function drawCurvedArrow(startPointX, startPointY,
- endPointX, endPointY,
- quadPointX, quadPointY,
- lineWidth,
- arrowWidth,
- color) {
- // BEST PRACTICE: the function changes color and lineWidth -> save context!
- ctx.save();
- ctx.strokeStyle = color;
- ctx.lineWidth = lineWidth;
- // angle of the end tangeant, useful for drawing the arrow head
- var arrowAngle = Math.atan2(quadPointX - endPointX, quadPointY -endPointY) + Math.PI;
- // start a new path
- ctx.beginPath();
- // Body of the arrow
- ctx.moveTo(startPointX, startPointY);
- ctx.quadraticCurveTo(quadPointX, quadPointY, endPointX, endPointY);
- // Head of the arrow
- ctx.moveTo(endPointX - (arrowWidth * Math.sin(arrowAngle - Math.PI / 6)),
- endPointY - (arrowWidth * Math.cos(arrowAngle - Math.PI / 6)));
- ctx.lineTo(endPointX, endPointY);
- ctx.lineTo(endPointX - (arrowWidth * Math.sin(arrowAngle + Math.PI / 6)),
- endPointY - (arrowWidth * Math.cos(arrowAngle + Math.PI / 6)));
- ctx.stroke();
- ctx.closePath();
- // BEST PRACTICE -> restore the context as we saved it at the beginning
- // of the function
- ctx.restore();
- }
This function takes as parameters the start and end points, the control point of the curve, the arrow width, the width of the arrow head.
It computes the angle of the arrow at its endpoint (line 14) in order to compute the rotated endpoints of the two lines of the arrow head (lines 24 and 29).
Notice that once again, as we modify the context properties (color, lineWidth) in the body of the function, we save and restore the context at the beginning / end of the function.
Bezier curves
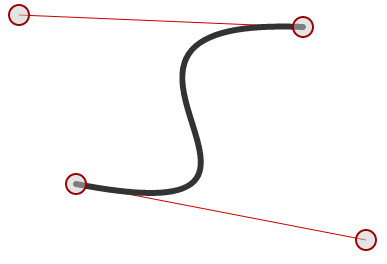
INTRODUCTION
Bezier curves are interesting mostly for drawing "S" shapes or asymmetric curves.
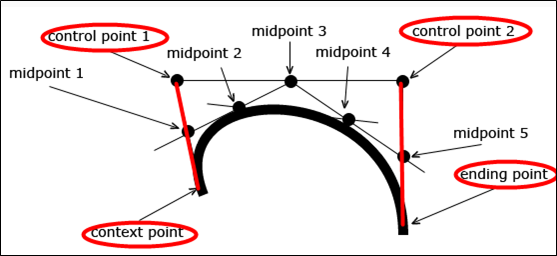
Bezier curves are defined by a context point, similarly to quadratic curves, two control points that define two tangents, and an ending point.
The first part of the curve is tangential to the imaginary line defined by the context point and the first control point. The second part of the curve is tangential to the imaginary line defined by the second control point and the ending point.
The best way to understand how they work is to check out one of these interactive applications:
TYPICAL USAGE OF BEZIER CURVES
Source code:
- ctx.moveTo(contextX, contextY);
- context.bezierCurveTo(controlX1, controlY1, controlX2, controlY2, endX, endY);
- // Optional : set lineWidth and stroke color
- context.lineWidth = 5;
- context.strokeStyle = "#0000ff";
- // Draw!
- ctx.stroke();
EXAMPLE 1
Try this interactive example here: http://jsbin.com/hodawa/2/edit
- context.beginPath();
- context.moveTo(100, 20);
- context.bezierCurveTo(290, -40, 200, 200, 400, 100);
- context.lineWidth = 5;
- context.strokeStyle = "#0000ff";
- context.stroke();
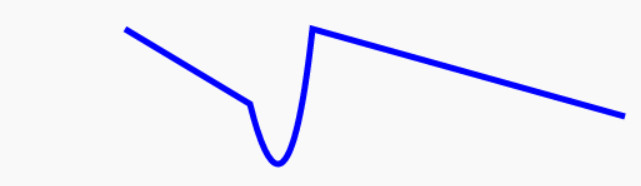
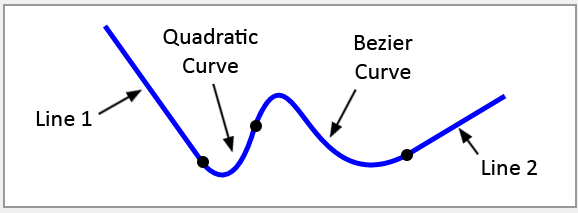
EXAMPLE 2 WITH LINES, QUADRATIC, AND BEZIER CURVES IN A PATH
Try this example online: http://jsbin.com/wifowa/1/edit
Extract from source code:
- context.beginPath();
- context.moveTo(100, 20);
- context.lineTo(200, 160);
- context.quadraticCurveTo(230, 200, 250, 120);
- context.bezierCurveTo(290, -40, 300, 200, 400, 150);
- context.lineTo(500, 90);
- // TRY COMMENTING THIS LINE OUT
- context.closePath();
- context.lineWidth = 5;
- context.strokeStyle = "#0000ff";
- context.stroke();
In this example we use the closePath() method to draw a line between the last path point and the first path point (line 11), so that the drawing looks like a pair of goggles.
Note how the different parts are linked together and make a "path":
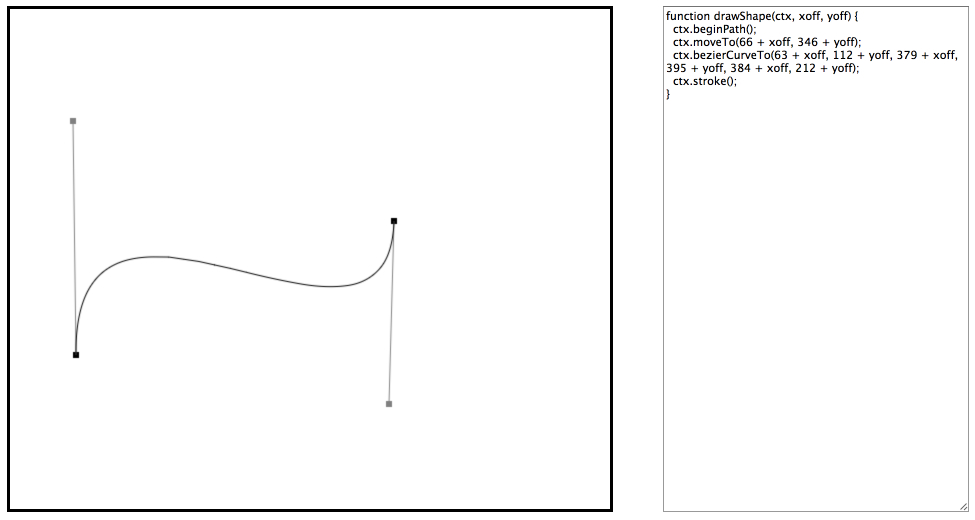
INTERESTING, INTERACTIVE TOOL FOR GENERATING CODE THAT DRAWS BEZIER CURVES
This tool is available online: http://www.victoriakirst.com/beziertool/, try it!
Screenshot:
No comments:
Post a Comment