About JavaScript and HTML5
So yes, during this course, in particular during Week 3 and 4, you will have to do a bit of JavaScript. But, DON'T PANIC!
We are providing here a basic guidance on JavaScript. If you want to learn more, there are lots of resources available on the Web. This document is here to help you start in good conditions. Remember that one great thing with these MOOCs courses is that everybody can help each other. Some of the classmates are really good in JavaScript and are usually very happy to help others when they encounter difficulties.
You will learn a lot by looking at examples, tweak them, clone and modify them, etc. Many students in the past who were real JavaScript beginners managed to do all the assignments (drawing and animating a monster with keyboard/mouse interaction)! And they did by just studying the provided examples.
EXTERNAL RESOURCES
- The book I used to learn JavaScript myself: Object Oriented JavaScript by Stoyan Stefanov
- Mozilla Developper Network has a JS guide too.
Extracts from the forum posts:
- Video tutorials at Treehouse are very slick, this includes a basic JavaScript course.
- Codecademy is also very good - very nice JavaScript introduction for beginners. I do recommend for those with no JS knowledge as it starts from scratch.
WHAT DO YOU NEED? HOW TO DEBUG? HOW TO CATCH ERRORS?
We will not look at the JavaScript syntax here, but more at "JavaScript in the browser", how it works, how to start writing code, etc.
First of all, you need to find a way to debug your code and see errors. If your work does not produce any results, you must know why!
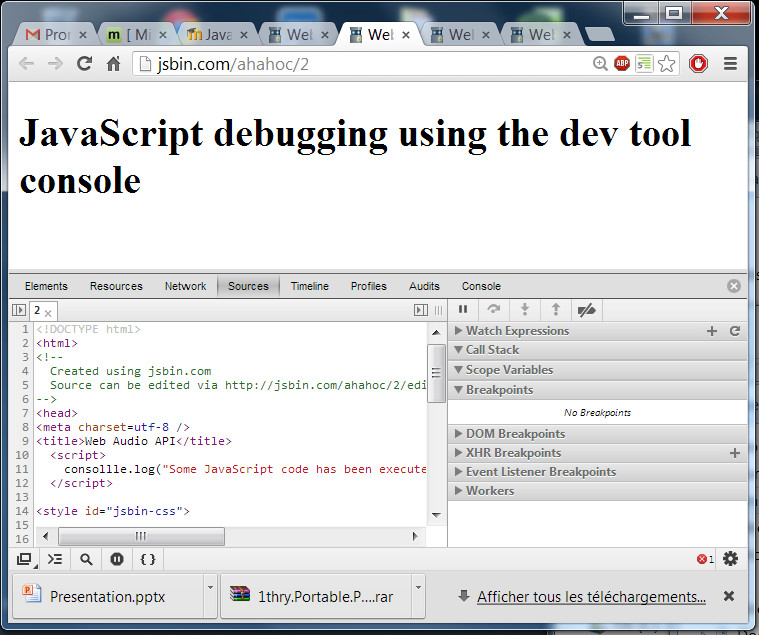
For that you will use the dev. tools of your browser. Press F12 on Windows or cmd-alt-i on Mac to open the dev. tools, then go to the console tab: this is where errors will be displayed, or messages of your own (use the console.log(string) JavaScript function in the JavaScript code embedded in your html page). In the console, you will be able to type any JavaScript command.
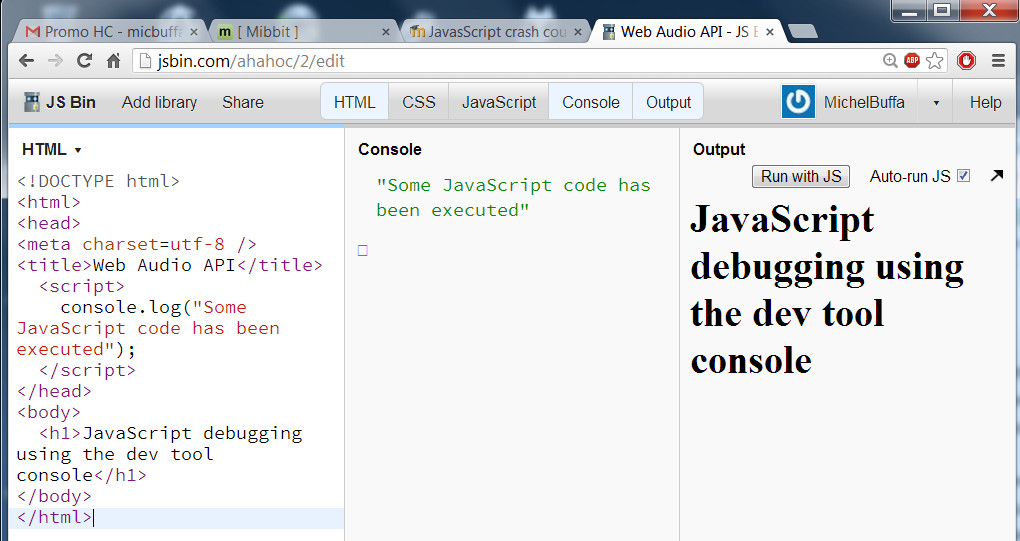
Let's look at this example on JS Bin:
The most simple way to add JavaScript code in an HTML page, is by using the <script>...</script>element.
The code in this example is executed sequentially when the page is loaded: the JavaScript code is executed before the browser could see the rest of the page (as the <script></script> is located before the <body>).
The H1 element, for example, does not exist in the Document Object Model, and has not yet been displayed when the JavaScript code is executed. If we move the <script></script> at the end of the document, then the H1 would have been built before the JavaScript code is executed.
The only line of code we have is console.log("Some JavaScript code has been executed");
This means "display in the JavaScript console the message...". If we open the console tab provided by jsbin.com in a dedicated tab (that redirects all console.log() messages), and re-execute the page (just type a space at the end of a line, this will re-render the page and display the message in the console), we see the message in the console tab, as well as in the dev. tools console. This is illustrated by the image below:
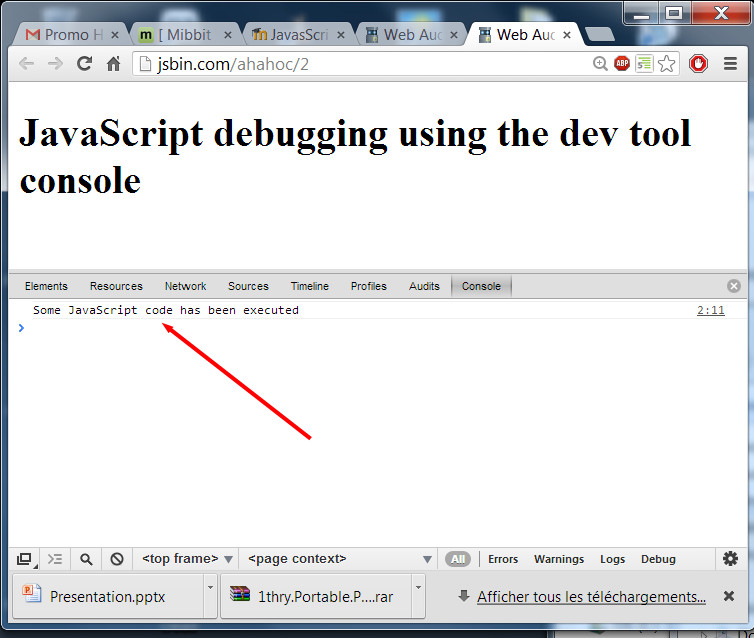
It is also possible to use the "real dev. tool console", and for this I recommend to run the application in a single window, not in the JS Bin editor. Press the black arrow on the top right of the output window, this will render the page as a standalone Web page, then press F12. You should see:
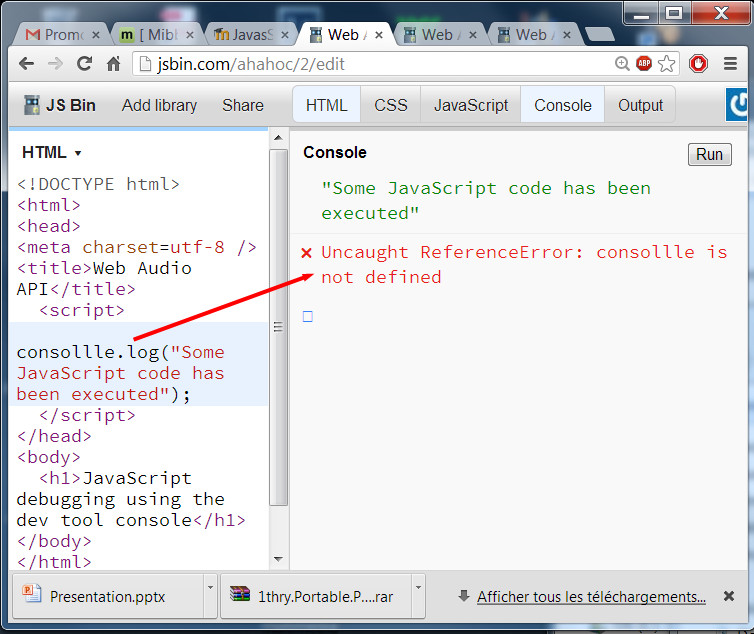
Ok, now, let's make an error, change console.log() into consollle.log(). Let's see what happens:
And if we run it standalone and use the dev. tool console:
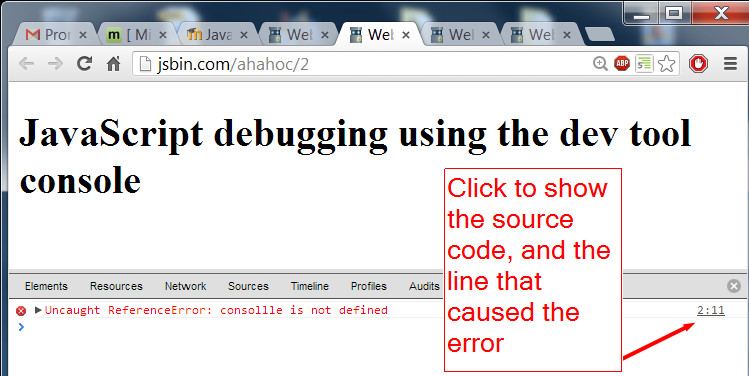
And if we click on the line number in the right, the dev. tool shows the source code centered on the line that caused the error:
Without such tools, debugging JavaScript code is impossible. So you need to look at some basic tutorials on how to use the dev. tools of your browsers, as the way they work differ one from another. But the principles remain the same.
Draw and animate graphics: the <canvas> element
INTRODUCTION
 The <canvas> tag is one of the "Flash killer" features of HTML5. This course will focus on the fundamental drawing capabilities of the HTML5 canvas.
The W3C HTML5 specification about the <canvas> element states that "The canvas element provides scripts with a resolution-dependent bitmap canvas, which can be used for rendering graphs, game graphics, or other visual images on the fly."
The canvas has been designed for pixel-based graphics, while SVG (Scalable Vector Graphics, another W3C standard) is for vector-based graphics.
Indeed, the canvas JavaScript drawing API supports different kind of shapes: lines, rectangles, ellipses, arcs, curves, text, images. Some drawing styles need to be specified that will affect the way shapes are drawn (color, drawing width, shadows, etc.). An alpha channel for drawing in transparent mode is also supported, as well as many advanced drawing modes and global filters (blur, etc.).
The canvas is also used to do animations at 60 frames per second (useful for games), to display videos with special effects, to display a webcam stream, and so on.
EXAMPLES
Example 1
Foot Chinko, one of the most popular free HTML5 games (released in 2015):

Example 2
Example 3
Love HTML5, a nice demo that shows 60 frames/s animation in a canvas, (written in 2009)!

Performance is generally good today, since most Web browsers support hardware acceleration or will add support soon. Back in 2009, this demo ran at only a few images per second on some low-end computers (smartphones that could run HTML5 demos, such as this one, did not exist at that time ) due to the lack of hardware acceleration support in the browser's implementations of the canvas API.
CURRENT SUPPORT BY BROWSERS (AS OF 2015)
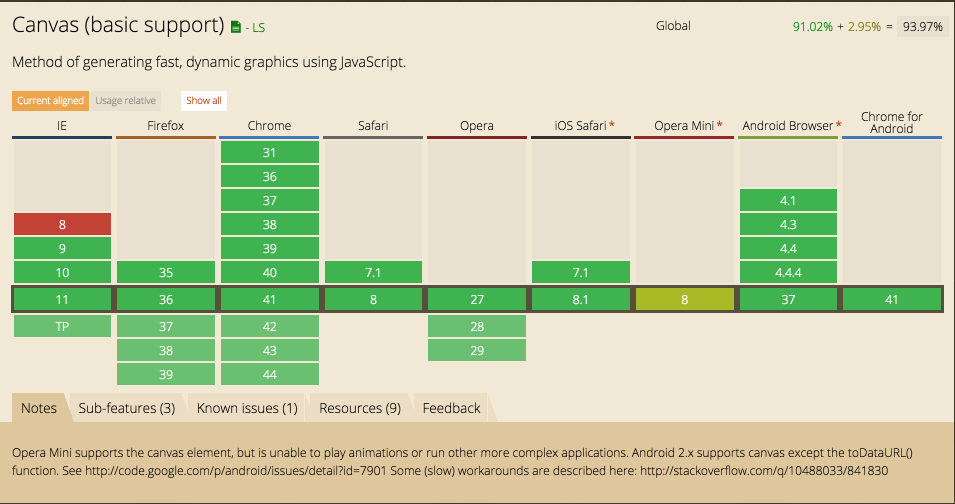
An up-to-date version of this table is at: http://caniuse.com/#feat=canvas
GOOD EXTERNAL RESOURCES
How to make the HTML5 canvas accessible to users with disabilities?
INTRODUCTION
The dynamic nature of the <canvas> element has made it difficult to use in applications that need to be accessible to people with disabilities. To be accessible, it must meet the following principles:
- Providing alternative content for what is drawn on the <canvas>,
- Exposing the location of shapes, paths, images drawn on the <canvas> to assistive technologies,
- Visually indicating whether or not a shape in the canvas had keyboard focus.
THE W3C CANVAS TASK FORCE
The Canvas Task Force of the W3C's HTML Working Group is working on different features to be added to the HTML5.1 canvas specification in order to address canvas accessibility. This is only preliminary work and browsers implementations are not available yet.
Read more on this topic:
- What the canvas element means for accessibility is an article written by Mark Sadecki (ex-W3C, now working at edX).
- From the W3C wiki: Canvas Element Accessibility Issues
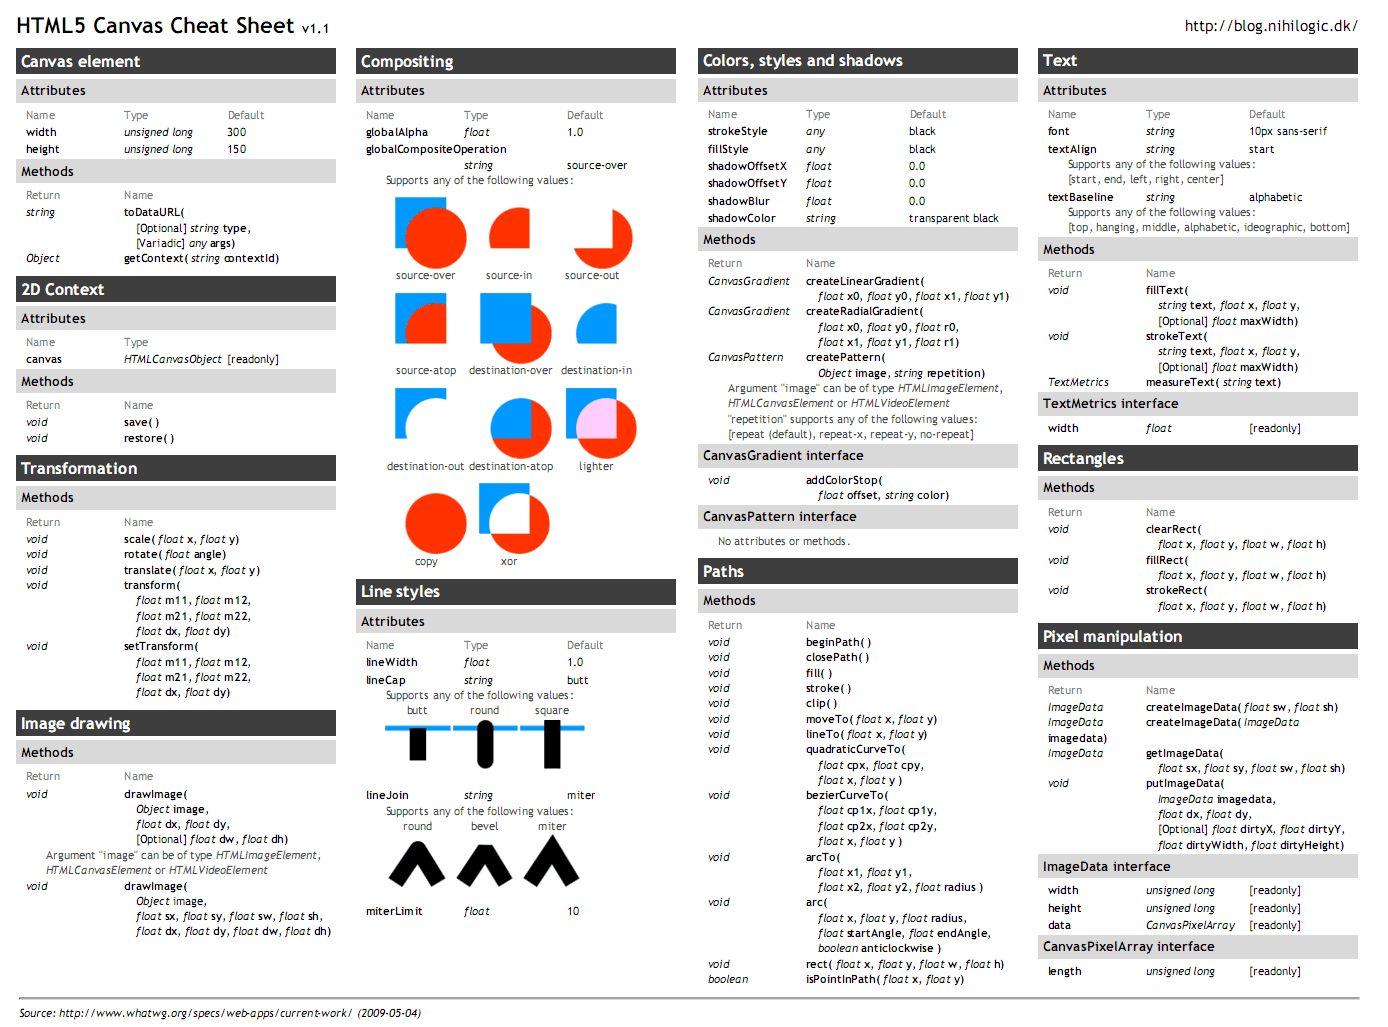
Canvas cheatsheet with all API methods and properties
This is a valuable resource we recommend either printing or keeping open in a separate browser tab. The original version was located at "http://blog.nihilogic.dk/2009/02/html5-canvas-cheat-sheet.html", but this URL does not work anymore. Here, we share here the mirrored versions (HTML and PDF ones).
HTML VERSION
- Just follow this link: https://simon.html5.org/dump/html5-canvas-cheat-sheet.html
PDF VERSION
The image links to a PDF, just click on it.
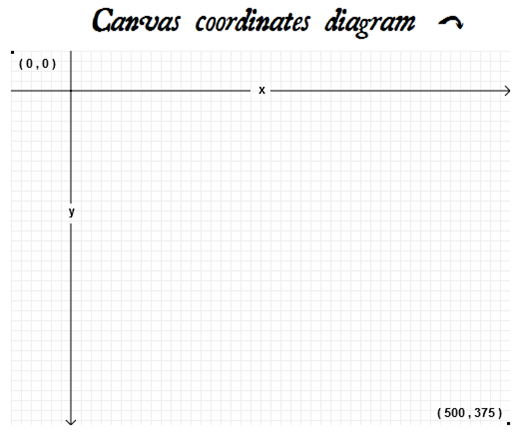
The canvas coordinate system
X AXIS IS HORIZONTAL, DIRECTED TO THE RIGHT
Y AXIS IS VERTICAL, DIRECTED DOWNWARDS
The coordinate system used for drawing in canvases is similar to the one used by many drawing APIs like Java2D: the (0 , 0) is in the top left corner while the X axis is going to the right and the Y axis to the bottom, like in the following picture (author Mark Pilgrim):
Typical use of the <canvas> element
DETAILED EXPLANATION OF THE EXAMPLE SHOWN IN THE VIDEO
Here are the different steps, a little more detailed, of the example demonstrated in the above video:
1 - Add the <canvas> element into an HTML page
- <canvas id="myCanvas" width="300" height="225">
- Fallback content that will be displayed in case the web browser
- does not support the canvas tag or in case scripting
- is disabled.
- </canvas>
Place code similar to the above somewhere in an HTML page. This example defines an area of 300 by 225 pixels on which content can be rendered with JavaScript.
Normally you should see nothing as a result, by default canvases are "transparent".
Make it visible using CSS: A good practice when you learn using canvases is to use some CSS to visualize the shape of the canvas. This is not mandatory, just a good trick...
The three lines of CSS will create a border around the canvas with id="myCanvas", of 1 pixel width, in black:
CSS code:
- <style>
- #myCanvas {
- border:1px solid black;
- }
- </style>
2 - Select the <canvas> element for use from JavaScript
We can have more than one <canvas> in a single page, and canvases will be manipulated with JavaScript like other elements in the DOM.
For example with:
- var canvas = document.getElementById("myCanvas");
... or with the querySelector() method introduced by HTML5, that use the CSS selector syntax for selecting elements:
- var canvas = document.querySelector("#myCanvas");
3 - get a "2D context" associated with the canvas, useful for drawing and setting drawing properties (color, etc.)
Once we have a pointer to the <canvas>, we can get a "context".
This particular object is the core of the canvas JavaScript API.
It provides methods for drawing, like fillRect(x, y, width, height) for example, that draws a filled rectangle, and properties for setting the color, shadows, gradients, etc.
Getting the context (do this only once):
- var ctx=canvas.getContext('2d');
Set the color for drawing filled shapes:
- ctx.fillStyle='red';
Draw a filled rectangle:
- ctx.fillRect(0,0,80,100);
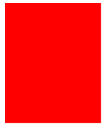
COMPLETE EXAMPLE THAT DRAWS A FILLED RECTANGLE IN RED
Result:
Source code:
- <!DOCTYPE html>
- <html lang="en">
- <head>
- <style>
- #myCanvas {
- border: 1px solid black;
- }
- </style>
- <script>
- var canvas, ctx;
- function init() {
- // This function is called after the page is loaded
- // 1 - Get the canvas
- canvas = document.getElementById('myCanvas');
- // 2 - Get the context
- ctx=canvas.getContext('2d');
- // 3 - we can draw
- drawSomething();
- }
- function drawSomething() {
- // draw a red rectangle
- ctx.fillStyle='#FF0000';
- ctx.fillRect(0,0,80,100);
- }
- </script>
- </head>
- <body onload="init();">
- <canvas id="myCanvas" width="200" height="200">
- Your browser does not support the canvas tag.
- </canvas>
- </body>
- </html>
Explanation
Only access elements when the DOM is ready:
Notice that we wrote an "init" function (line 12) that is called only when the page has been entirely loaded (we say "when the DOM is ready"). There are several ways to do that. In this example we used the <body onload="init();"> method, at line 32.
It's a good practice to have such a function, as we cannot access the elements of the page before the page has been loaded entirely and before the DOM is ready.
Another way consists in putting the JavaScript code at the end of the document (between <script>...</script>), right before the </body>. In that case when the JavaScript code is executed, the DOM has already been constructed.
Start by getting the canvas and the context:
Before drawing or doing anything interesting with the canvas, we must first get its drawing "context". The drawing context defines the drawing methods and properties we can use.
Good practice is to get the canvas, the context, the width and height of the canvas and other global objects in this "init" function.
After the context is set, we can draw, but before, let's set the current color for filled shapes:
The example shows at line 27 the use of the fillStyle property - useful for specifying the way shapes will be filled. In our case this line indicates the color of all the filled shapes we are going to draw:
- ctx.fillStyle='#FF0000';
The context property named fillStyle is used here. This property can be set with a color, a gradient, or a pattern. We will see examples of these later on in the course.
When we set it with a color, we use the CSS3 syntax.
The example says that all filled shapes will use the color "#FF0000", which corresponds to a pure red color using the CSS RGB hexadecimal encoding (we could also have used ctx.fillStyle='red');
Then we can draw:
- ctx.fillRect(0,0,80,100);
This line is a call to the method fillRect(top left X coordinate, top left Y coordinate, width, height), which draws a filled rectangle.
The way the rectangle will be filled depends on the current value of several properties of the context, in particular the value of the fillStyle property. So, in our case, the rectangle will be red.
SUMMARY OF THE DIFFERENT STEPS
- Declare the canvas, not forgetting to add an id attribute, and fallback content:
<canvas id="myCanvas" width="200" height="200">
...fallback content...
</canvas> - Get a reference to the canvas in a JavaScript variable using the DOM API:
var canvas=document.getElementById('myCanvas'); - Get the context for drawing in that canvas:
var ctx=canvas.getContext('2d'); - Specify some drawing properties (optional):
ctx.fillStyle='#FF0000'; - Draw some shapes:
ctx.fillRect(0,0,80,100); Drawing principles
MORE DETAILS ABOUT THE "CONTEXT" OBJECT
Before we go on, we should take some time to clarify the way we draw on HTML5 canvases. We already mentioned that we use a graphic context for all the main operations. Whenever a shape, a text, or an image is drawn, the current values of the different properties of the graphic context are taken into account. Some are relevant only for certain kinds of shapes or drawing modes, but you must be aware that it is always the current values of these drawing properties that are used.We'll see later on that there are ways to save and restore this whole set of values, but for now, let's go into more detail on some of the properties and methods we've already encountered, and introduce new ones.MORE ABOUT PROPERTIES AND METHODS OF THE CONTEXT OBJECT
fillStyle is a property of the context, similar in a way to a CSS property.
Its value can be one of the following:- a color,
- a pattern (texture), or
- a gradient.
The default value is the color black. Any kind of drawing in "fill mode" will use the value of this property to determine how to render the "filled part" of the drawing: any filled rectangle will be filled black by default, any filled circle will be filled in black, and so on.As long as we don't modify the value of this property, all drawing commands for filled shapes will use the current value.Note that we will study in detail how to use colors, gradients and patterns later, but for now we introduce some properties and values so that you can understand the principles of canvas drawing.fillStyle and the other context properties can be considered to be "global variables" of the context.fillRect(x, y, width, height): a call to this method draws a filled rectangle.
The two first parameters are the coordinates of the top left corner of the rectangle. This method uses the current value of the filledStyle property to determine how to fill the rectangle.- ctx.fillStyle='pink';
- ctx.fillRect(10,10,200,200);
Produce this result: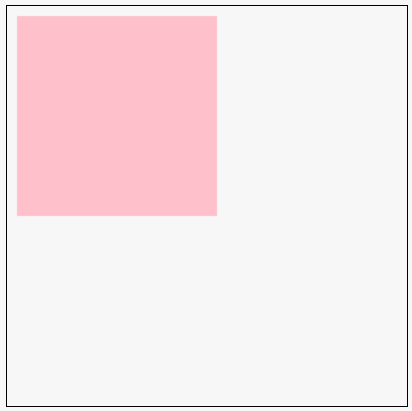
strokeStyle is a property of the context similar to fillStyle, but this time for indicating how the shape's outline should be rendered.
The possible values are the same as those for the fillStyle property: a color, a pattern, or a gradient. This property will be taken into account when wireframe shapes are drawn.strokeRect(x, y, width, height): like fillRect(...), but instead of drawing a filled rectangle the rectangle is drawn in wireframe mode.
- ctx.strokeStyle='blue';
- ctx.strokeRect(10,10,200,200);
...produces this result: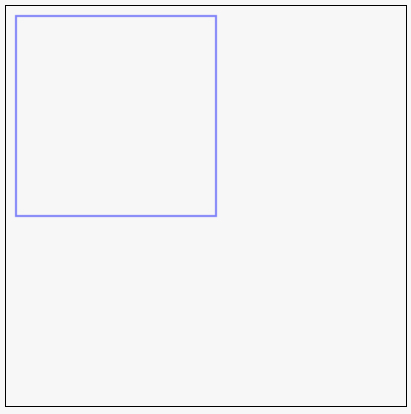 Only the outline of the rectangle will be drawn, and it will be drawn using the value of the strokeStyleproperty.
clearRect(x, y, width, height): a call to this method erases the specified rectangle.
Actually it draws it in a color called "transparent black" (!) that corresponds to the initial state of the rectangle as if no drawing had occurred.- ctx.fillStyle='pink';
- ctx.fillRect(10,10,200,200);
- ctx.clearRect(50, 50, 20, 20);
The result is: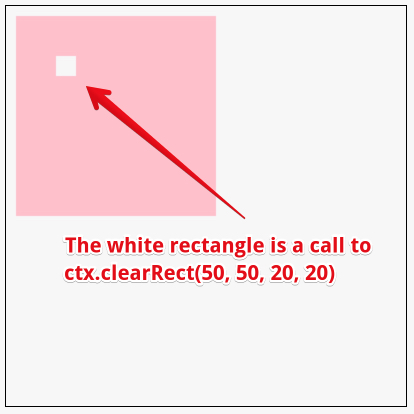
LET'S SEE SOME SIMPLE EXAMPLES...
Draw a wireframe red rectangle, width lineWidth = 3 pixels.
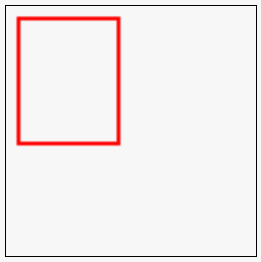 Extract from the source code (the part that draws the rectangle):
- function drawSomething() {
- // draw a red rectangle, line width=3 pixels
- ctx.lineWidth=3;
- ctx.strokeStyle='red';
- ctx.strokeRect(10,10,80,100);
- }
Here, we used "stroke" instead of "fill" in the property and method names (lines 4 and 5): strokeStyle instead of fillStyle, strokeRect(...) instead of fillRect(...).We also introduced a new property of the context, that applies only when drawing in "stroke" mode, thelineWidth property (line 3), that is used for setting the width of the shape outline. The value is in pixels.DRAW 2 FILLED RED RECTANGLES WITH A BLUE OUTLINE OF 5 PIXELS AND SOME TEXT
Let's continue with another example. This time we will draw several shapes that share the same colors, they will be filled in red, with a blue outline. We also show how to draw a text message with a given font.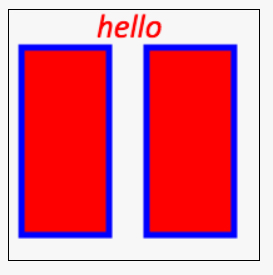 Source code extract:
- function drawSomething() {
- // set the global context values
- ctx.lineWidth=5;
- ctx.fillStyle='red';
- ctx.strokeStyle='blue'
- // font for all text drawing
- ctx.font = 'italic 20pt Calibri';
- // Draw the two filled red rectangles
- ctx.fillRect(10, 30, 70, 150);
- ctx.fillRect(110, 30, 70, 150);
- // Draw the two blue wireframe rectangles
- ctx.strokeRect(10, 30, 70, 150);
- ctx.strokeRect(110, 30, 70, 150);
- // Draw a message above the rectangles
- ctx.fillText("hello", 70, 22);
- }
This example shows the "global" nature of the context properties. Once you set the filled color to red, any shapes you draw in filled mode will be red. This is true for all the context properties. We set in lines 3-7 some of these properties, and all following calls to context methods for drawing rectangles or text will depend on them. The two filled rectangles at lines 10-11 will be red, the two wireframe rectangles drawn at lines 14-15 will be blue, etc.Line 18 shows how to draw a text message at an X position of 70 and a Y position of 22. The font is set at line 7 using the font property of the context. The syntax is the same we use in CSS for using "system fonts".If you would like to draw the filled text message in green for example, you should set the ctx.fillStyleproperty to "green" after you draw the rectangles and before you draw the text (i.e just before line 18).SUMMARY OF WHAT WE LEARNED
- "stroke" means "wireframe" or "outlined", it is a prefix for setting properties or calling methods that will affect wireframe shapes, "fill" is a prefix for filled shapes.
- To set the properties of wireframe shapes use ctx.strokeStyle= ..., for filled shapes usectx.fillStyle=... So far the values we have used are colors, expressed as strings. Example:ctx.strokeStyle = 'blue';
- To draw a wireframe rectangle use ctx.strokeRect(x, y, width, height), to draw a filled rectangle use ctx.fillRect(x, y, width, height);
- To set the line width of wireframe shapes, use the ctx.lineWidth property. Example ctx.lineWidth = 10; ctx.strokeRect(0, 0, 100, 100); will draw a 100x100 rectangle in wireframe mode, with an outline width of 10 pixels.
- To draw a text message use ctx.strokeText(message, x, y) or ctx.fillText(message, x, y), for wireframe text or filled text respectively.
- To set the character font use the ctx.font property; the value is a font in CSS syntax, for example: ctx.font = 'italic 20pt Calibri';
2D transformations: changing the coordinate system
INTRODUCTION
In this part of the course, we introduce the basics of 2D transformations, a powerful tool that will make things easier as soon as you have to:- Draw complex shapes at given positions, with given orientations and sizes,
- Draw shapes relative to one another.
Let's start with some simple examples before looking at how we use 2D transforms.LET'S DRAW THREE RECTANGLES!
If we draw three rectangles of size 100x200 in a 400x400 canvas, one at (0, 0) and another one at (150, 0), and a third one at (300, 0), here is the result and the corresponding code.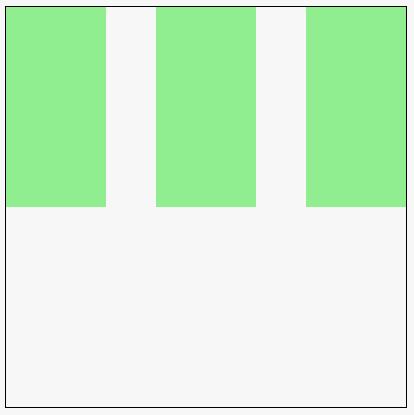 JavaScript code extract (see the online example at JS Bin for the complete running code)
- function drawSomething() {
- ctx.fillStyle='lightgreen';
- ctx.fillRect(0,0,100,200);
- ctx.fillRect(150,0,100,200);
- ctx.fillRect(300,0,100,200);
- }
LET'S MODIFY THE CODE SO THAT WE CAN DRAW THESE RECTANGLES AT ANY X AND Y POSITION
What if we wanted to draw these 3 rectangles at another position, as a group? We would like to draw all of them a little more towards the bottom, for example... Let's add some parameters to the function: the X and Y position where we're going to draw the rectangles.The full JavaScript code is (see online running example):- var canvas, ctx;
- function init() {
- // This function is called after the page is loaded
- // 1 - Get the canvas
- canvas = document.getElementById('myCanvas');
- // 2 - Get the context
- ctx=canvas.getContext('2d');
- // 3 - we can draw
- drawSomething(0, 100);
- }
- function drawSomething(x, y) {
- // draw 3 rectangles
- ctx.fillStyle='lightgreen';
- ctx.fillRect(x,y,100,200);
- ctx.fillRect(x+150,y,100,200);
- ctx.fillRect(x+300,y,100,200);
- }
At line 10, we called the drawSomething(...) function with 0 and 100 as parameters, meaning "please add an offset of 0 in X and 100 in Y directions to what is drawn by the function...If you look at the code of the modified function, you will see that each call to fillRect(...) uses the x and y parameters instead of hard coded values. Like that, if we call it with parameters (0, 100), then all rectangles will be drawn 100 pixels to the bottom (offset in y). Here is the result: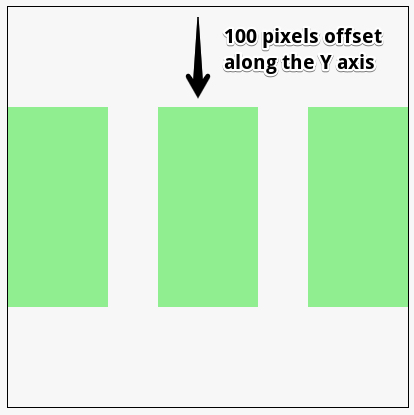
OK, NOW LET'S DRAW A SMALL MONSTER'S HEAD WITH RECTANGLES
Now we can start having some fun... let's draw a monster's head, only with rectangles (online version):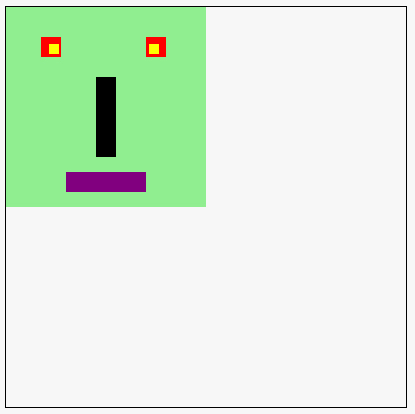 An extract of the JavaScript source code is:
- function drawMonster(x, y) {
- // head
- ctx.fillStyle='lightgreen';
- ctx.fillRect(x,y,200,200);
- // eyes
- ctx.fillStyle='red';
- ctx.fillRect(x+35,y+30,20,20);
- ctx.fillRect(x+140,y+30,20,20);
- // interior of eye
- ctx.fillStyle='yellow';
- ctx.fillRect(x+43,y+37,10,10);
- ctx.fillRect(x+143,y+37,10,10);
- // Nose
- ctx.fillStyle='black';
- ctx.fillRect(x+90,y+70,20,80);
- // Mouth
- ctx.fillStyle='purple';
- ctx.fillRect(x+60,y+165,80,20);
- }
As you can see, the code uses the same technique, but starts becoming less and less readable. The Xs and Ys at the beginning of each call makes understanding the code harder, etc.However, there is a way to simplify this => 2D geometric transformations!GEOMETRIC TRANSFORMATIONS: CHANGING THE COORDINATE SYSTEM
The idea behind 2D transformations is that instead of modifying all the coordinates passed as parameters to each call to drawing methods like fillRect(...), we will keep all the drawing code "as is". For example, if the monster of our previous example was drawn at (0, 0), we could just translate (or rotate, or scale) the original coordinate system.Let's take a piece of code that draws something corresponding to the original coordinate system, located at the top left corner of the canvas:- function drawMonster(x, y) {
- // head
- ctx.fillStyle='lightgreen';
- ctx.fillRect(0,0,200,200);
- // eyes
- ctx.fillStyle='red';
- ctx.fillRect(35,30,20,20);
- ctx.fillRect(140,30,20,20);
- // interior of eye
- ctx.fillStyle='yellow';
- ctx.fillRect(43,37,10,10);
- ctx.fillRect(143,37,10,10);
- // Nose
- ctx.fillStyle='black';
- ctx.fillRect(90,70,20,80);
- // Mouth
- ctx.fillStyle='purple';
- ctx.fillRect(60,165,80,20);
- // coordinate system at (0, 0)
- drawArrow(ctx, 0, 0, 100, 0, 10, 'red');
- drawArrow(ctx, 0, 0, 0, 100, 10, 'red');
- }
This code is the just the same as in the previous example except that we removed all Xs and Yx in the code. We also added at the end (lines 25-26) two lines of code that draw the coordinate system. ThedrawArrow(startX, startY, endX, endY, width, color) function is a utility function that we will present later. You can see it in the source code of the complete online example on JS Bin: look in the JavaScript tab.Note that the X and Y parameters are useless for now...Result: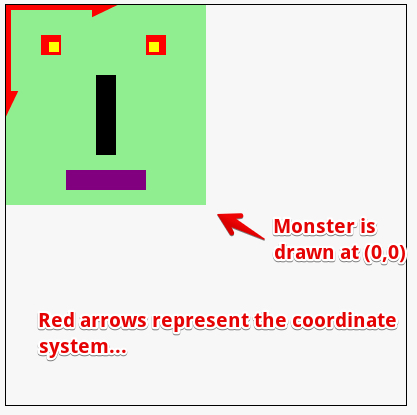
Translation using ctx.translate(offsetX, offsetY)
Now, instead of simply calling drawMonster(0, 0), we will call first ctx.translate(100, 100), and look at the result (online code: http://jsbin.com/yuhamu/2/edit)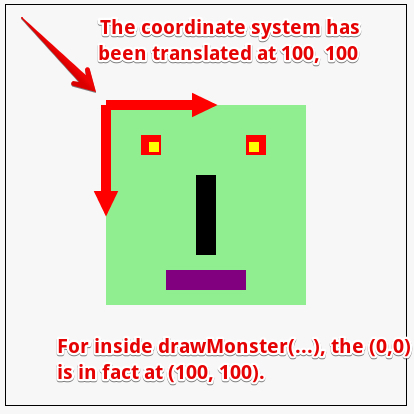 JavaScript code extract:
- ctx.translate(100, 100);
- drawMonster(0, 0);
Line 1 changes the position of the coordinate system, line 2 draws a monster in the new translated coordinate system. All subsequent calls to drawing methods will be affected and will work in this new system too.OTHER TRANSFORMATIONS: ROTATE, SCALE
There are other transformations available:- ctx.rotate(angle), with angle in radians. Note that the order of transformations is important, usually we translate, then rotate, then scale... If you change this order, you need to know what you are doing...
- ctx.scale (sx, sy), where scale(1, 1) corresponds to "no zoom", scale(2, 2) corresponds to "zooming 2x" and scale(0.5, 0.5) corresponds to zooming out to see the drawings half as big as before. If you do not use the same values for sx and sy, you do "asymmetric scaling", you can distort a shape horizontally or vertically. Try changing the values in the source code of the next online examples.
Here is the previous example, but this time we translated the coordinate system, then rotated it with an angle equal to PI/4 , then we scaled it so that units are half as big (see the example online):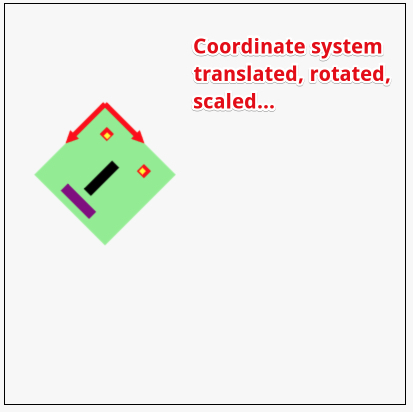 And here is the code of the transformations we used, followed by the call to the function that draws the monster:
- ctx.translate(100, 100);
- ctx.rotate(Math.PI/4);
- ctx.scale(0.5, 0.5);
- drawMonster(0, 0);
Line 1 does: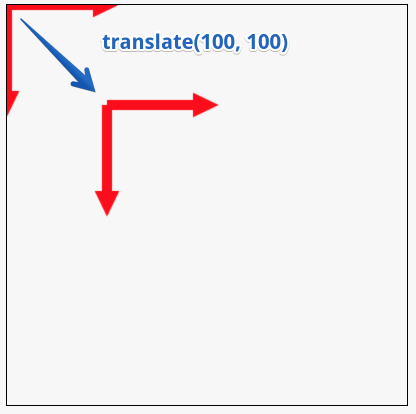 Line 2 does:
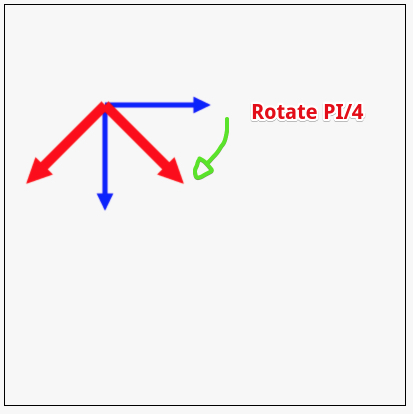 Line 3 does:
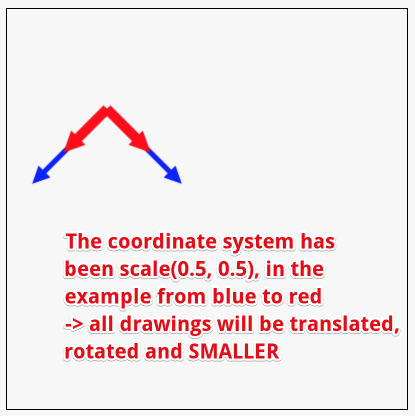 Line 4 draws the monster in this new translated, rotated, scaled coordinate system:
BEWARE: ALL DRAWINGS TO COME WILL BE IN THAT MODIFIED COORDINATE SYSTEM!
If we draw two shapes at two different positions, they will be relative to this new coordinate system.For example, this code (online at http://jsbin.com/yuhamu/4/edit):- ctx.translate(100, 100);
- ctx.rotate(Math.PI/4);
- ctx.scale(0.5, 0.5);
- // Draw the monster at (0, 0)
- drawMonster(0, 0);
- // Draw a filled rectagle at (250, 0)
- ctx.fillRect(250, 0, 100, 100);
... gives this result (there is an error in the red text below, it should say "x=250, y=0"):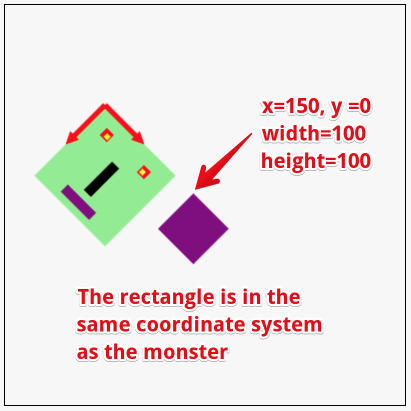
HOW CAN WE RESET THE COORDINATE SYSTEM, HOW CAN WE GO BACK TO THE PREVIOUS ONE?
Aha, this is a very interesting question... we will give the answer very soon in the section on saving/restoring the context :-)Knowledge check 3.2.8 (not graded)
ctx.translate(100, 100);
ctx.scale(2, 2);
ctx.strokeRect(0, 0, 100, 100);
Saving and restoring the context
There are two methods for saving and restoring the context properties: ctx.save()and ctx.restore().
What will be saved: fillStyle and strokeStyle, lineWidth, previous coordinate system, etc., that is ALL properties that affect drawing!
A call to ctx.save() will probably save the context property values in a hardware register on your graphics card. Multiple contexts can be saved consecutively and restored.
Contexts saved will be stacked, the last one that has been saved will be restored by the next call to restore(), so it is very important to have one restore for each save.
Best practice: save the context at the beginning of any function
that changes the context, restore it at the end of the function!
that changes the context, restore it at the end of the function!
EXAMPLE OF A FUNCTION THAT CHANGES THE CONTEXT AND RESTORES IT AFTER EXECUTION
Online example: http://jsbin.com/moporu/2/edit
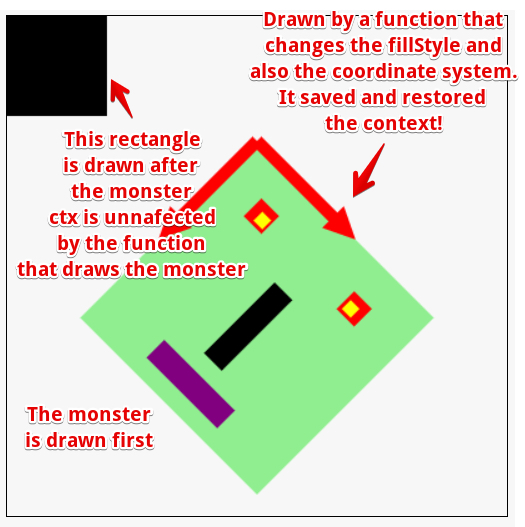
We took the last example we saw (the one with the monster, from the previous page of the course), and slightly modified the function that draws the monster:
- We added parameters for setting the position and orientation of the monster, and added calls to ctx.translate(x, y) and ctx.rotate(angle) in the function.
- We added parameters for the head's color and eyes' color.
- We saved the context at the beginning of the function (BEST PRACTICE),
- We restored it at the end (BEST PRACTICE).
Source code extract of this function: notice at lines 3 and 26 how we save/restore the context at the beginning/end. Right after saving the context, we modify the coordinate system (lines 7-8). The rest of the code is nearly the same as in the last version of the monster example.
- function drawMonster(x, y, angle, headColor, eyeColor) {
- // BEST PRACTICE : SAVE CONTEXT AND RESTORE IT AT THE END
- ctx.save();
- // Moves the coordinate system so that the monster is drawn
- // at position (x, y)
- ctx.translate(x, y);
- ctx.rotate(angle);
- // head
- ctx.fillStyle=headColor;
- ctx.fillRect(0,0,200,200);
- // eyes
- ctx.fillStyle='red';
- ctx.fillRect(35,30,20,20);
- ctx.fillRect(140,30,20,20);
- // interior of eye
- ctx.fillStyle=eyeColor;
- ctx.fillRect(43,37,10,10);
- ctx.fillRect(143,37,10,10);
- ...
- // BEST PRACTICE !
- ctx.restore();
- }
html link visited code examples
ReplyDeleteLink visited text-decoration underline
Thanks for information.
ReplyDeleteDigital Marketing Course in Laxmi Nagar
Digital Marketing Institute in Delhi
Digital Marketing training in Preet Vihar
Online Digital Marketing Course in India
Digital Marketing Institute in Delhi
Digital Marketing Institute in Delhi
Hindi Movie
Digital Marketing Institute In Greater Noida
BEST IVF CENTER IN DELHI
Best Digital Marketing
At Neinstein Personal Injury Lawyers, we pride ourselves on being successful. You will not pay any legal fees until your case is successfully settled. We operate on what is typically called a contingency fee (percentage of recovery) basis. The percentage that applies to your case depends on the type of case. This information will be explained to you from the outset and will form part of our Retainer Agreement.
ReplyDeletepersonal injury lawyers
birth injury lawyer Toronto
accident lawyer
toronto car accident lawyer
spinal cord injury lawyers
Hamilton Car Accident Lawyers
Thanks for your informative post. This content is really helpful and works for me. We are also serving personal injury and brain injury lawyer services in oakville. And at the end of my comment, i just want to say that your posts are very good to keep updating us.
ReplyDeleteoakville personal injury lawyers
injury lawyer in oakville
brain injury lawyer