Canvas context: colors
INTRODUCTION
In previous examples, we saw how to set the current color using the strokeStyle and fillStyle properties of the canvas context object.
We will go a little more into details about colors and we will see how we can use gradients or patterns/textures/images (in other words: fill shapes or fill the outline of the shapes with some images that repeat themselves).
COLORS AND TRANSPARENCY
You can use the same syntax for colors that is supported by CSS3. The next lines show possible values/syntaxes.
- ctx.strokeStyle = 'red';
- ctx.fillStyle = "#00ff00";
- ctx.strokeStyle = "rgb(0, 0, 255)";
- ctx.fillStyle = "rgba(0, 0, 255, 0.5)";
Note that:
- All values are strings,
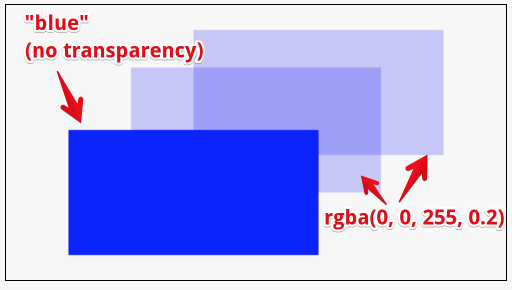
- Line 4 defines a "transparent color", the "a" of "rgba" means "alpha channel". Its value is between 0 and 1, where 0 means "completely transparent" and 1 means "opaque".
Here is an example that shows how to draw different filled rectangles in blue, with different levels of transparency.
Try it online: http://jsbin.com/duwaxa/3/edit
Linear gradients
It is possible to define the stroke or the fill style as a "gradient", a set of interpolated colors, like in this example below (try it online at: http://jsbin.com/ruguxi/2/edit)
The concept of linear gradient is seen as an "invisible" rectangle in which a set of colors are interpolated along a line.
The gradient becomes visible when we draw shapes on top of the invisible gradient, and when the fillStyleor strokeStyle property has for value this gradient.
Here are the different steps needed:
Step 1: define a linear gradient
Syntax:
- ctx.createLinearGradient(x0,y0,x1,y1);
... where the (x0, y0) and (x1, y1) parameters define "the direction of the gradient" (as a vector with a starting and an ending point). This direction is an invisible line along which the colors that compose the gradient will be interpolated.
Let's detail an example:
- grdFrenchFlag = ctx.createLinearGradient(0, 0, 300, 0);
This line defines the direction of the gradient: a virtual, invisible line that goes from the top left corner of the canvas (0, 0) to the top right corner of the canvas (300, 0). The interpolated colors will propagate along this line.
If this gradient is going to be reused by different functions, it is a good practice to create/initialize it in a function called when the page is loaded and to store it in a global variable.
Step 2: add a number of "color stops" to this gradient
We will add a set of "colors" and "stops" to this gradient. The stops go from 0 (beginning of the virtual line defined just above), to 1 (end of the virtual line). A color associated with a value of 0.5 will be right in the middle of the virtual line.
Here is an example that corresponds to an interpolated version of the French flag, going from blue to white, then to red, with proportional intervals. We define three colors, blue at position 0, white at position 0.5 and red at position 1:
- grdFrenchFlag.addColorStop(0, "blue");
- grdFrenchFlag.addColorStop(0.5, "white");
- grdFrenchFlag.addColorStop(1, "red");
Step 3: draw some shapes
First, let's set the fillStyle or strokeStyle of the context with this gradient, then let's draw some shapes "on top of the gradient".
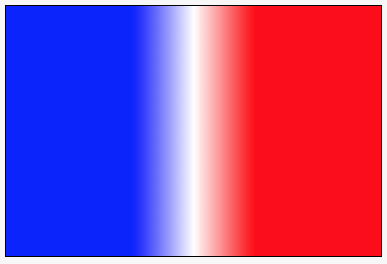
In our example, the gradient corresponds to an invisible rectangle that fills the canvas. If we draw a rectangle of the canvas size, it should be filled with the entire gradient:
- ctx.fillStyle = grdFrenchFlag;
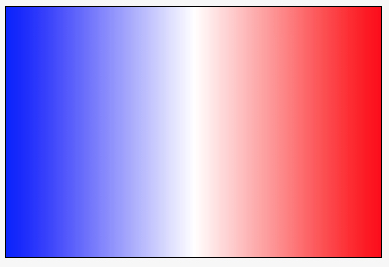
- ctx.fillRect(0, 0, 300, 200);
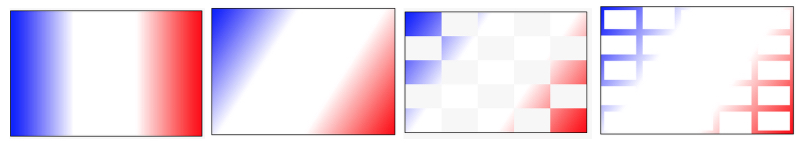
The result is shown below: a big rectangle that fills the whole canvas, with colors going from blue (left) to white (middle) to red (right).
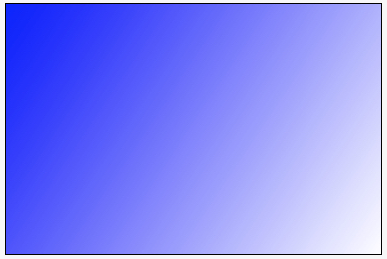
CHANGING THE DIRECTION OF THE GRADIENT
If you modify the source code that defines the direction of the gradient as follows...
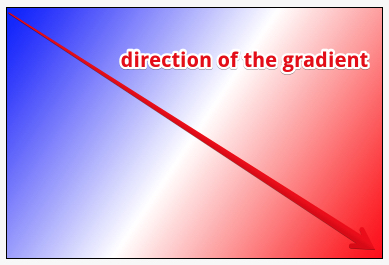
- grdFrenchFlag = ctx.createLinearGradient(0, 0, 300, 200);
... then you will define a gradient that goes from the top left corner of the canvas to the bottom right of the canvas. Let's see what it does (online version here: http://jsbin.com/ruguxi/4/edit):
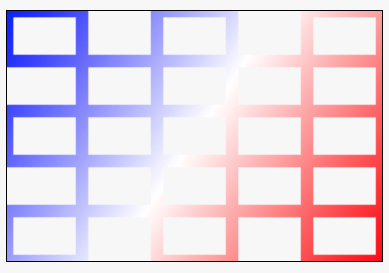
DRAWING SHAPES THAT DO NOT COVER THE WHOLE GRADIENT
Instead of drawing a filled rectangle that covers the whole surface of the canvas, let's draw several smaller rectangles.
Online example: http://jsbin.com/baluxa/3/edit
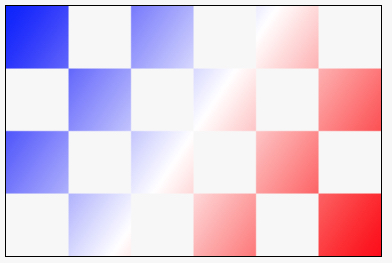
Note that the canvas has its default background color where we did not draw anything. And where we drawn rectangles, we can see "through" and the colors from the gradient are visible.
Here is the code that draws the checkboard:
- ctx.fillStyle = grdFrenchFlag;
- ctx.fillRect(0, 0, 50, 50);
- ctx.fillRect(100, 0, 50, 50);
- ctx.fillRect(200, 0, 50, 50);
- ctx.fillRect(50, 50, 50, 50);
- ctx.fillRect(150, 50, 50, 50);
- ctx.fillRect(250, 50, 50, 50);
- ctx.fillRect(0, 100, 50, 50);
- ctx.fillRect(100, 100, 50, 50);
- ctx.fillRect(200, 100, 50, 50);
- ctx.fillRect(50, 150, 50, 50);
- ctx.fillRect(150, 150, 50, 50);
- ctx.fillRect(250, 150, 50, 50);
This code is rather ugly isn't it? It would have been better to use a loop...
Here is function that draws a chessboard (online example here: http://jsbin.com/dekiji/2/edit):
- // n = number of cells per row/column
- function drawCheckboard(n) {
- ctx.fillStyle = grdFrenchFlag;
- var l = canvas.width;
- var h = canvas.height;
- var cellWidth = l / n;
- var cellHeight = h / n;
- for(i = 0; i < n; i+=2) {
- for(j = 0; j < n; j++) {
- ctx.fillRect(cellWidth*(i+j%2), cellHeight*j, cellWidth,cellHeight);
- }
- }
- }
The two loops (lines 11-15) draw only one cell out of two (see the i+=2 at line 11), and shift them one cell on the right if the current line is an odd number (the formula cellWidth * (I+j%2) does that, when computing the X coordinate of each cell).
This code is much more complex that the previous one, takes 16 lines instead of 13, but is much more powerful. Try to call the function with a value of 10, 20, or 2...
DRAWING OUTLINED SHAPES WITH GRADIENTS
As we used fillStyle and fillRect for drawing rectangles filled with a gradient, we can also usestrokeStyle and strokeRect in order to draw wireframed rectangles. The next example is just a variation of the previous one, where we just used the lineWidth property to set the outline of the rectangles at 5 pixels: http://jsbin.com/dekiji/4/edit
Extract from source code:
- function drawCheckboard(n) {
- ctx.strokeStyle = grdFrenchFlag;
- ctx.lineWidth=10;
- ...
- for(i = 0; i < n; i+=2) {
- for(j = 0; j < n; j++) {
- ctx.strokeRect(cellWidth*(i+j%2), cellHeight*j, cellWidth,cellHeight);
- }
- }
- }
WHAT HAPPENS IF WE DEFINE A GRADIENT SMALLER THAN THE CANVAS?
Let's go back to the very first example of this page. The one with the blue-white-red interpolated French flag. This time we will define a gradient that is smaller. Instead of going from (0, 0) to (300, 0), it will go from(100, 0) to (200, 0), while the canvas remains the same (width=300, height=200).
- grdFrenchFlag = ctx.createLinearGradient(100, 0, 200, 0);
Like in the first example we will draw a filled rectangle that is the same size of the canvas. Here is the online version: http://jsbin.com/ruvuta/1/edit, and here is a screenshot of the result:
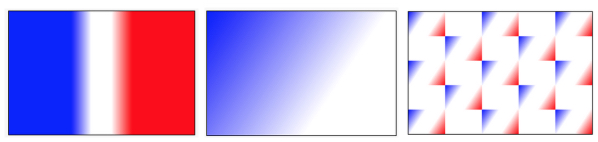
We notice that "before" the gradient start, the first color of the gradient is repeated without any interpolation (columns 0-100 are all blue), then we "see through" and the gradient is drawn (columns 100-200), then the last color of the gradient is repeated without any interpolation (columns 200-300 are red).
WHAT HAPPENS IF WE DEFINE A GRADIENT BIGGER THAN THE CANVAS?
Nothing special, we will "see through the drawn shapes" and parts of the gradient that are located in the canvas area will be shown. You can try this example that defines a gradient twice bigger than the canvas:
- grdFrenchFlag = ctx.createLinearGradient(0, 0, 600, 400);
And if we draw the same rectangle with the canvas size, here is the result:
The red color is far away further than the bottom right corner.... we see only the first top left quarter of the gradient.
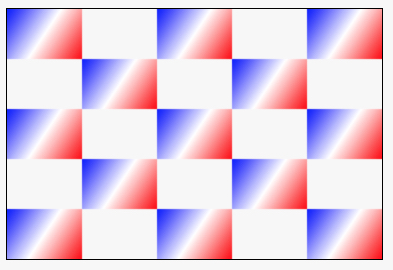
DRAW SHAPES THAT SHARE THE SAME GRADIENT AS A WHOLE
This time, we would like to draw the chessboard with the gradient in each cell. How can we do this with one single gradient?
We can't! At least we can't without recreating it for each cell!
It suffices to create a new gradient before drawing each filled rectangle, and set it with the starting and ending point of its direction/virtual line accordingly to the rectangle coordinates. Here is an online example and the resulting display:
Extract from source code:
- function setGradient(x, y, width, height) {
- grdFrenchFlag = ctx.createLinearGradient(x, y, width, height);
- grdFrenchFlag.addColorStop(0, "blue");
- grdFrenchFlag.addColorStop(0.5, "white");
- grdFrenchFlag.addColorStop(1, "red");
- // set the new gradient to the current fillStyle
- ctx.fillStyle = grdFrenchFlag;
- }
- // n = number of cells per row/column
- function drawCheckboard(n) {
- var l = canvas.width;
- var h = canvas.height;
- var cellWidth = l / n;
- var cellHeight = h / n;
- for(i = 0; i < n; i+=2) {
- for(j = 0; j < n; j++) {
- var x = cellWidth*(i+j%2);
- var y = cellHeight*j;
- setGradient(x, y, x+cellWidth, y+cellHeight);
- ctx.fillRect(x, y, cellWidth, cellHeight);
- }
- }
- }
We wrote a function setGradient(startX, startY, endX, endY) that creates a gradient and set thefillStyle context property so that any filled shape drawn will be with this gradient.
In the drawCheckBoard(...) function we call it just before drawing rectangles. Like that, each rectangle is drawn using its own gradient.
THIS FLAG IS NOT REALLY LOOKING LIKE THE FRENCH FLAG, ISN'T IT?
Indeed the French flag in these images is more accurate:
We slightly modified the examples of this chapter so that the flag looks more like the French flag. Look at these modified versions below, and try to find out what has changed in the gradient definitions:
- http://jsbin.com/zefogoneko/1/edit
- http://jsbin.com/bocogowuku/1/edit
- http://jsbin.com/dafufuwunu/1/edit
- http://jsbin.com/runuzamiva/1/edit
- http://jsbin.com/yocosocowe/1/edit
- http://jsbin.com/tuwogokovi/1/edit
- http://jsbin.com/jemarudica/1/edit
Radial gradients
BASIC PRINCIPLE / SYNTAX: DEFINE TWO CIRCLES AT GRADIENT CREATION
Radial gradients are for creating gradients that propagate/interpolate colors along circles instead of propagating/interpolating along a virtual line, like linear gradients.Here is an example of a radial gradient that interpolates the color of the rainbow. Online version: http://jsbin.com/mijoni/2/edit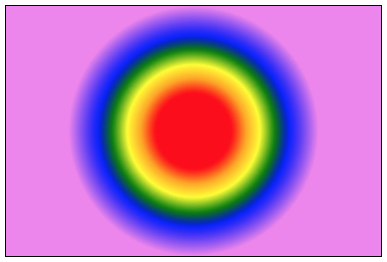 The gradient is defined like that in the example:
- var grd = context.createRadialGradient(150, 100, 30, 150, 100, 100);
- grd.addColorStop(0, "red");
- grd.addColorStop(0.17, "orange");
- grd.addColorStop(0.33, "yellow");
- grd.addColorStop(0.5, "green");
- grd.addColorStop(0.666, "blue");
- grd.addColorStop(1, "violet");
- context.fillStyle = grd;
The method from the context object createRadialGradient(cx1, cy1, radius1, cx2, cy2, radius2) takes as the first three parameters the "starting" circle of the gradient, and as the three last parameters, the "ending circle".In the above example, the gradients starts at a circle located at (150, 100), with a radius of 30, and propagates to a circle with the same center as the first one (150, 100), but with a bigger radius of 100. Here, we can see them: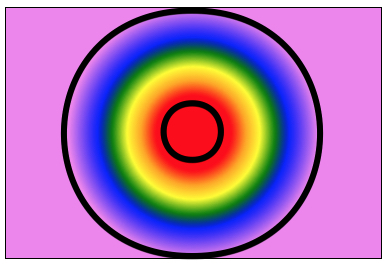 The way we added color stops is similar to what we have see with linear gradients.
WHAT HAPPENS IF THE CIRCLES ARE NOT LOCATED AT THE SAME PLACE?
You obtain some nice effects, here we set the second circle's center 60 pixels to the right of the first circle's center (cx = 210 instead of 150). Online example: http://jsbin.com/fufelef/1/edit?html- grd = ctx.createRadialGradient(150, 100, 30, 210, 100, 100);
And here is the result: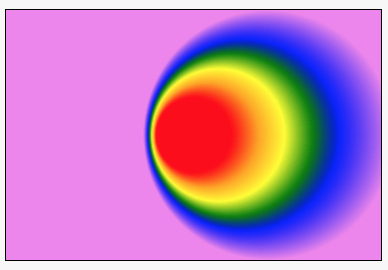
WHAT HAPPENS IF THE GRADIENT IS SMALLER OR LARGER THAN THE SHAPES WE DRAW?
Like for the linear gradient, if the gradient is smaller, then for the area "before" the first stop color, this color will be used to fill the shape. This is the case of the red color inside the small circle of the gradient in our example: it is filled in red!For the area outside of the gradient, the last stop color is used, this is the case in our example with the purple color that fills the rest of the filled rectangle area "after the external circle of the gradient.
Painting with patterns
PRINCIPLE
The principle of "pattern" drawing consists in repeating an image (if the image is smaller than the surface of the shape you are going to draw) for filling the surface of objects to be drawn (either filled or stroked).
To illustrate this principle, in the next examples, we are going to draw rectangles using this pattern:
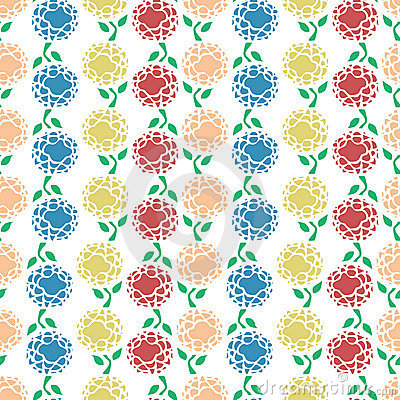
We will need to do some steps before drawing any shapes with this pattern:
- Create a JavaScript image object
- var imageObj = new Image();
- Define a callback function that will be called once the image has been fully loaded in memory, we cannot draw before the image has been loaded.
- imageObj.onload = function(){
- ...
- }
- Set the source of this image to the URL of the pattern (in our example with url of the pattern),
- imageObj.src = "http://www.myserver.com/myRepeatablePattern.png";
- As soon as step 3 is executed, an HTTP request is sent in background by the browser, and when the image is loaded in memory, the callback defined at step 2 is called. We create a pattern object inside, from the loaded image:
- // callback called asynchronously, after the src attribute of imageObj is set
- imageObj.onload = function(){
- // We enter here when the image is loaded, we create a pattern object.
- // a good practice is to set this as a global variable, easier to share
- pattern1 = ctx.createPattern(imageObj, "repeat");
- };
- Inside the callback function (or inside a function called from inside the callback) we can draw.
- // callback called asynchronously, after the src attribute of imageObj is set
- imageObj.onload = function(){
- pattern1 = ctx.createPattern(imageObj, "repeat");
- // Draw a textured rectangle
- ctx.fillStyle = pattern1;
- ctx.fillRect(10, 10, 500, 800);
- };
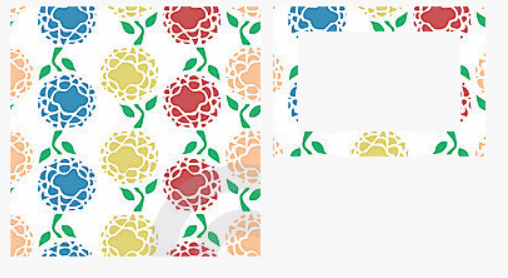
EXAMPLE 1: DRAW TWO RECTANGLES WITH A PATTERN (ONE FILLED, ONE STROKED)
Online example: http://jsbin.com/qezojo/1/edit
Here we have two rectangles drawn using a pattern (an image that can be repeated along the X and Y axis). The first one is a filled rectangle while the second one is "stroked" with a lineWidth of 10 pixels.
HTML source code:
- <!DOCTYPE html>
- <html>
- <body onload="init();">
- <canvas id="myCanvas" width="500" height="400">
- Your browser does not support the canvas tag. </canvas>
- </body>
- </html>
JavaScript source code:
- var canvas, ctx, pattern1;
- function init() {
- canvas = document.querySelector('#myCanvas');
- ctx = canvas.getContext('2d');
- // We need 1) to create an empty image object, 2) to set a callback function
- // that will be called when the image is fully loaded, 3) to create a
- // pattern object, 4) to set the fillStyle or the strokeStyle property of
- // the context with this pattern, 5) to draw something
- // WE CANNOT DRAW UNTIL THE IMAGE IS FULLY LOADED -> draw from inside the
- // onload callback only !
- // 1 - Allocate an image
- var imageObj = new Image();
- // 2 - callback called asynchronously, after the src attribute of imageObj
- // is set
- imageObj.onload = function(){
- // We enter here only when the image has been loaded by the browser
- // 4 - Pattern creation using the image object
- // Instead of "repeat", try different values : repeat-x, repeat-y,
- // or no-repeat, You may draw larger shapes in order to see
- // different results
- // It is a good practice to leave this as a global variable if it
- // will be reused by other functions
- pattern1 = ctx.createPattern(imageObj, "repeat");
- // 5 - Draw things. Here a textured rectangle
- ctx.fillStyle = pattern1;
- ctx.fillRect(10, 10, 200, 200);
- // ... And a wireframe one
- ctx.lineWidth=20;
- ctx.strokeStyle=pattern1;
- ctx.strokeRect(230, 20, 150, 100);
- };
- // 3 - Send the request for loading the image
- // Settingthe src attribute will tell the browser to send an asynchronous
- // request.
- // When the browser will get an answer, the callback above will be called
- imageObj.src = "http://www.dreamstime.com/colourful-flowers-repeatable-pattern-thumb18692760.jpg";
- }
EXAMPLE 2: THE REPEATABILITY OF A PATTERN
To "better" see the repeatability of the pattern, here is the same example with a 1000x1000 pixel wide canvas.
Online version here: http://jsbin.com/befiti/3/edit, and here is the result:
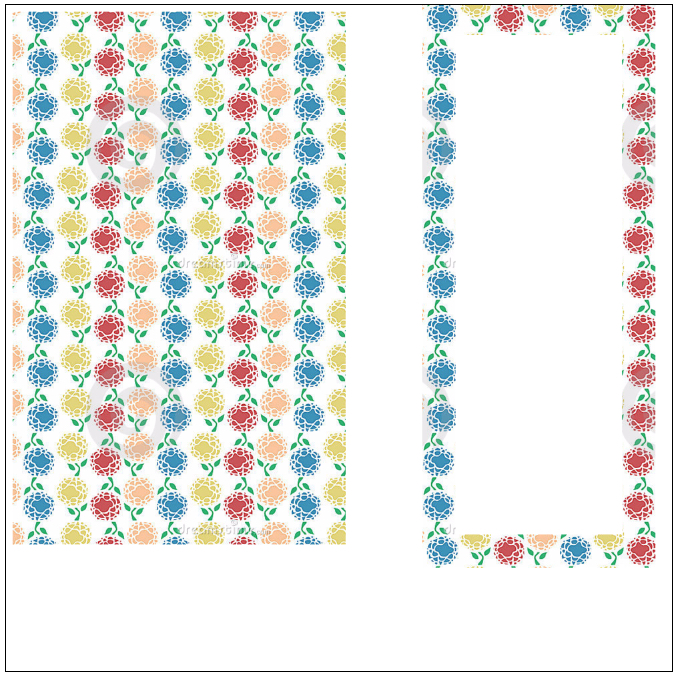
You can change the way the pattern is repeated by modifying the second parameter of this method:
- pattern1 = ctx.createPattern(imageObj, "repeat");
Please try: repeat-x, repeat-y or no-repeat as acceptable values. Just change this line in the online example and you will see live results.
Multiple image loader (for advanced users, or just take it as it is: a utility function you can reuse)
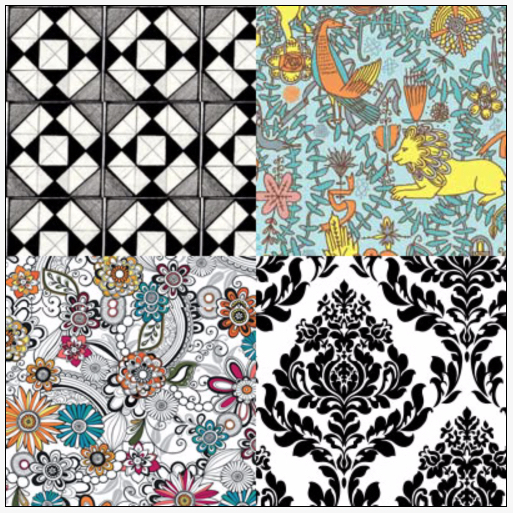
See below the 4 rectangles drawn with 4 different patterns.
DRAW WITH MULTIPLE PATTERNS? WE NEED TO LOAD ALL OF THEM BEFORE DRAWING!
We said earlier that we cannot draw before the image used by a pattern is loaded. This can become rapidly complicated if we need to draw using multiple patterns. We need a way to load all images and then, only when all images have been loaded, start drawing.
JavaScript is an asynchronous language. When you set the src attribute of an image, then an asynchronous request is sent by the browser, and then after a while, the onload callback is called... The difficult part to understand for those who are not familiar with JavaScript is that these requests are done in parallel and we do not know when the images will be loaded, and in which order.
SOLUTION: A MULTIPLE IMAGE LOADER THAT COUNTS THE LOADED IMAGES AND CALLS A FUNCTION YOU PASS WHEN DONE!
The trick consists in having an array of URLs that will be used by our multiple image loader, then in the onloadcallback, that will be called once per image loaded, we count the number of images effectively loaded.
When all images have been loaded, then we call a callback function that has been passed to our loader.
A complete example code that produces the result shown at the beginning of this page is at: http://jsbin.com/fufiyu/6/edit
Define the list of images to be loaded
- // List of images to load, we used a JavaScript object instead of
- // an array, so that named indexes (aka properties)
- // can be used -> easier to manipulate
- var imagesToLoad = {
- flowers:
- 'http://cdn2.digitalartsonline.co.uk/images/features/1675/intro.jpg',
- lion: 'http://farm3.static.flickr.com/2319/2486384418_8c031fec76_o.jpg',
- blackAndWhiteLys: 'http://pshero.com/assets/tutorials/0062/final.jpg',
- tiledFloor:
- 'https://blogger.googleusercontent.com/img/b/R29vZ2xl/AVvXsEgnqMJRDWtsilwvxWgAMjjW6IK1Kah5eirAmWJj5CWr-KUCaLNoCDaieJOJfE7HjT5U3MbVWtTAZScjUc4l1uQSelMu1S5xrAoghKM8SFNyAfmG3LBYQLkNGHkP_dV74J7kygSSzl0ht5I/s1600/symmetry:assymetry+repeatable+pattern.jpg'
- };
Notice that instead of using a traditional array, we defined this list as a JavaScript object, with properties whose names will be easier to manipulate (flowers, lion, tiledFloor, etc.).
The image loader function
- function loadImages(imagesToBeLoaded, drawCallback) {
- var imagesLoaded = {};
- var loadedImages = 0;
- var numberOfImagesToLoad = 0;
- // get num of images to load
- for(var name in imagesToBeLoaded) {
- numberOfImagesToLoad++;
- }
- for(var name in imagesToBeLoaded) {
- imagesLoaded[name] = new Image();
- imagesLoaded[name].onload = function() {
- if(++loadedImages >= numberOfImagesToLoad) {
- drawCallback(imagesLoaded);
- } // if
- }; // function
- imagesLoaded[name].src = imagesToBeLoaded[name];
- } // for
- } // function
This function takes as a parameter the list of images to be loaded, and a drawCallback function that will be called only once all images have been loaded. This callback takes as a parameter a new object that is the list of images that have been loaded (see line 16).
We first count the number of images to load (lines 7-9), then for each image to be loaded we create a new JavaScript image object (line 12) and set its src attribute (line 19), this will start to load the image.
When an image comes in, the onload callback is called (line 14) and inside, we increment the number of images loaded (line 15) and test if this number is >= of the total number of images that should be loaded. If this is the case, the callback function is called (line 16).
Example of use of this loader
- loadImages(imagesToLoad, function(imagesLoaded) {
- patternFlowers = ctx.createPattern(imagesLoaded.flowers, 'repeat');
- patternLion = ctx.createPattern(imagesLoaded.lion, 'repeat');
- patternBW = ctx.createPattern(imagesLoaded.blackAndWhiteLys, 'repeat');
- patternFloor = ctx.createPattern(imagesLoaded.tiledFloor, 'repeat');
- drawRectanglesWithPatterns();
- });
- Line 1 is the call to the image loader, the first parameter is the list of images to be loaded, while the second parameter is the callback function that will be called once all images have been loaded.
- Lines 2-5: in this callback we create patterns from the loaded images (note the use of the property names imagesLoaded.flowers, etc. that makes the code easier to read).
- Line 7: then we call a function that will draw the rectangles.
Here is the function:
- function drawRectanglesWithPatterns() {
- ctx.fillStyle=patternFloor;
- ctx.fillRect(0,0,200,200);
- ctx.fillStyle=patternLion;
- ctx.fillRect(200,0,200,200);
- ctx.fillStyle=patternFlowers;
- ctx.fillRect(0,200,200,200);
- ctx.fillStyle=patternBW;
- ctx.fillRect(200,200,200,200);
- }
Drawing shadows
CONTEXT PROPERTIES TO DRAW WITH SHADOWS
There are 4 properties of the canvas context that are useful for indicating that we want to draw shapes with shadows:
- shadowColor: color to use for shadows,
- shadowBlur: blur level for shadows,
- shadowOffsetX: horizontal distance of the shadow from the shape,
- shadowOffsetY: vertical distance of the shadow from the shape
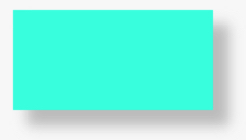
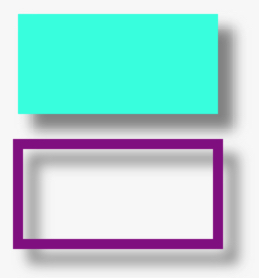
EXAMPLE 1: SIMPLE
Online example: http://jsbin.com/wivubi/3/edit
HTML source code:
- <!DOCTYPE html>
- <html>
- <body onload = init();>
- <canvas id="myCanvas" width="400" height =800>
- Your browser does not support the canvas tag.
- </canvas>
- </body>
- </html>
JavaScript source code:
- var canvas, ctx;
- function init() {
- canvas = document.getElementById('myCanvas');
- ctx = canvas.getContext('2d');
- // call to a function that will set the 4 context properties for shadows
- setShadow();
- // all drawings that will occur will cast shadows
- // first green filled rectangle
- ctx.fillStyle = "#22FFDD";
- ctx.fillRect(20, 20, 200, 100);
- // second stroked rectangle
- ctx.strokeStyle = "purple";
- ctx.lineWidth=10;
- ctx.strokeRect(20, 150, 200, 100);
- }
- // We define the 4 properties in a dedicated function, for clarity
- function setShadow() {
- ctx.shadowColor = "Grey"; // color
- ctx.shadowBlur = 20; // blur level
- ctx.shadowOffsetX = 15; // horizontal offset
- ctx.shadowOffsetY = 15; // vertical offset
- }
- Lines 21-27: we set the 4 properties that define shadows in a dedicated function, for a better clarity.
- Line 8: we called this function once before drawing the rectangles.
- Lines 11-18: we draw a filled and a stroked rectangle. Both rectangles cast shadows.
EXAMPLE 2: UNWANTED SHADOWS!
Let's take a previous example: the one that draws a filled circle with an outline: http://jsbin.com/gazuba/2/edit
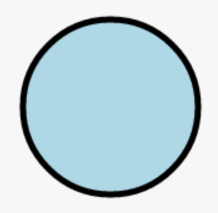
Now, let's add a shadow to it, online example: http://jsbin.com/gokemu/1/edit
Here is an extract from the code:
- ...
- ctx.beginPath();
- // Add to the path a full circle (from 0 to 2PI)
- ctx.arc(centerX, centerY, radius, 0, 2*Math.PI, false);
- // With path drawing you can change the context
- // properties until a call to stroke() or fill() is performed
- ctx.fillStyle = "lightBlue";
- // add shadows before drawing the filled circle
- addShadows();
- // Draws the filled circle in light blue
- ctx.fill();
- // Prepare for the outline
- ctx.lineWidth = 5;
- ctx.strokeStyle = "black";
- // draws AGAIN the path (the circle), this
- // time in wireframe
- ctx.stroke();
- // Notice we called context.arc() only once ! And drew it twice
- // with different styles
- ...
- function addShadows() {
- ctx.shadowColor = "Grey"; // color
- ctx.shadowBlur = 20; // blur level
- ctx.shadowOffsetX = 15; // horizontal offset
- ctx.shadowOffsetY = 15; // vertical offset
- }
And here is the result:
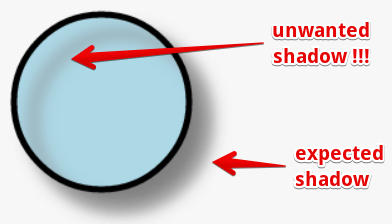
Ah, indeed, the call to ctx.fill() casts a shadow, but the call to ctx.stroke(), that paints the whole path again, casts a shadow too, and this time the outline produces an unwanted shadow... How can we avoid this effect, while using the same technique for drawing the path?
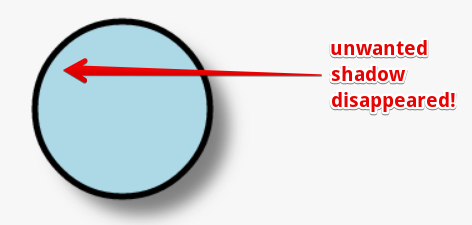
The trick consists in saving the context before setting the shadow properties, then draw the filled circle, then restore the context (to its previous state: without shadows), then draw the outlined circle by callingctx.stroke().
Correct version of the code: http://jsbin.com/kedobi/2/edit
- ...
- // save the context before setting shadows and drawing the filled circle
- ctx.save();
- // With path drawing you can change the context
- // properties until a call to stroke() or fill() is performed
- ctx.fillStyle = "lightBlue";
- // add shadows before drawing the filled circle
- addShadows();
- // Draws the filled circle in light blue
- ctx.fill();
- // restore the context to its previous saved state
- ctx.restore();
- ...
And here is the final result:
Styling lines
Several context properties can be used to set the thickness of the shape outlines, the way line end caps are drawn, etc.
They apply to all shapes that are drawn in path mode (lines, curves, arcs) and some apply also to rectangles.
LINE STYLE: CHANGE THE LINE THICKNESS
We have seen this before. This is done by changing the value (in pixels) of the lineWidth property of the context:
- ctx.lineWidth = 10; // set the thickness of every shape drawn in stroke/wireframe mode to 10 pixels
Here is a complete example where we draw with a lineWidth of 20 pixels. You can play with the complete interactive example here: http://jsbin.com/dacuco/2/edit
Source code:
- <!DOCTYPE html>
- <html>
- <head>
- <title>A simple example of lineWidth property use</title>
- </head>
- <body>
- <canvas id="myCanvas" width="500">
- Your browser does not support the canvas tag.
- </canvas>
- <script>
- var canvas = document.getElementById('myCanvas');
- var ctx = canvas.getContext('2d');
- // first path
- ctx.moveTo(20, 20);
- ctx.lineTo(100, 100);
- ctx.lineTo(100, 0);
- // second part of the path
- ctx.moveTo(120, 20);
- ctx.lineTo(200, 100);
- ctx.lineTo(200, 0);
- // indicate stroke color + draw first part of the path
- ctx.strokeStyle = "#0000FF";
- // Current line thickness is 20 pixels
- ctx.lineWidth = 20;
- ctx.stroke(); // draws the whole path at once
- // Draws a rectangle in immediate mode
- ctx.strokeRect(230, 10, 100, 100);
- </script>
- </body>
- </html>
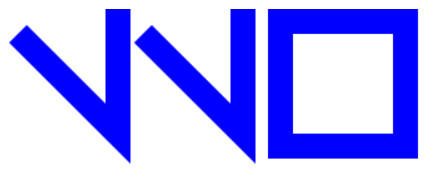
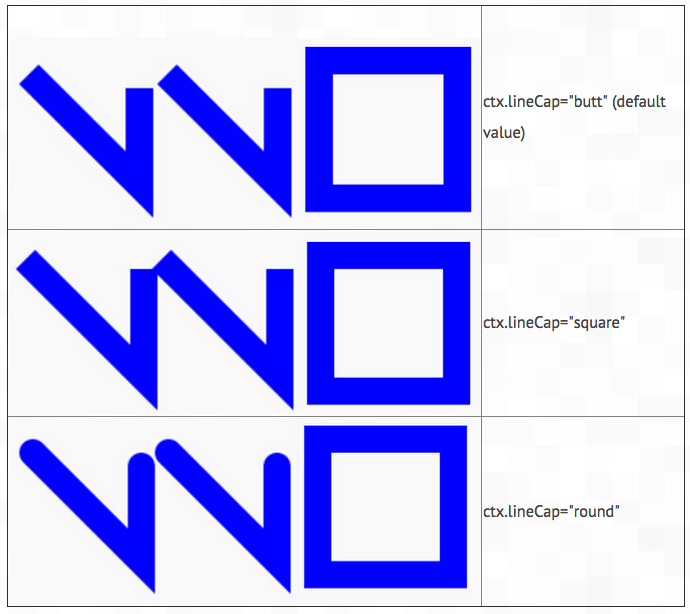
LINE STYLE: CHANGING THE END CAPS FOR A LINE
The lineCap property of the context indicates the way line end caps are rendered. Possible values are butt(default), round, square (from top to bottom in the next illustration) . Note that a value of "round" or "square" makes the lines slightly longer than the default value "butt".
Try the next example interactively: http://jsbin.com/yaliya/2/edit
Source code:
- <!DOCTYPE html>
- <html>
- <head>
- <title>A simple example of lineCap property use</title>
- </head>
- <body>
- <canvas id="myCanvas" width="500">
- Your browser does not support the canvas tag.</canvas>
- <script>
- var canvas = document.getElementById('myCanvas');
- var ctx = canvas.getContext('2d');
- // first path
- ctx.moveTo(20, 20);
- ctx.lineTo(100, 100);
- ctx.lineTo(100, 30);
- // second part of the path
- ctx.moveTo(120, 20);
- ctx.lineTo(200, 100);
- ctx.lineTo(200, 30);
- // indicate stroke color + draw first part of the path
- ctx.strokeStyle = "#0000FF";
- // Current line thickness is 20 pixels
- ctx.lineWidth = 20;
- // Try different values : butt, square, round
- ctx.lineCap = "round";
- ctx.stroke();
- // Draws a rectangle
- ctx.strokeRect(230, 10, 100, 100);
- </script>
- </body>
- </html>
Note that in this example, the rectangle is not affected. It has no line ends visible - all its sides meet. However, the next property we're going to look at will have an effect on rectangles!
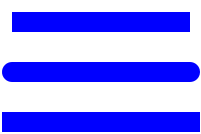
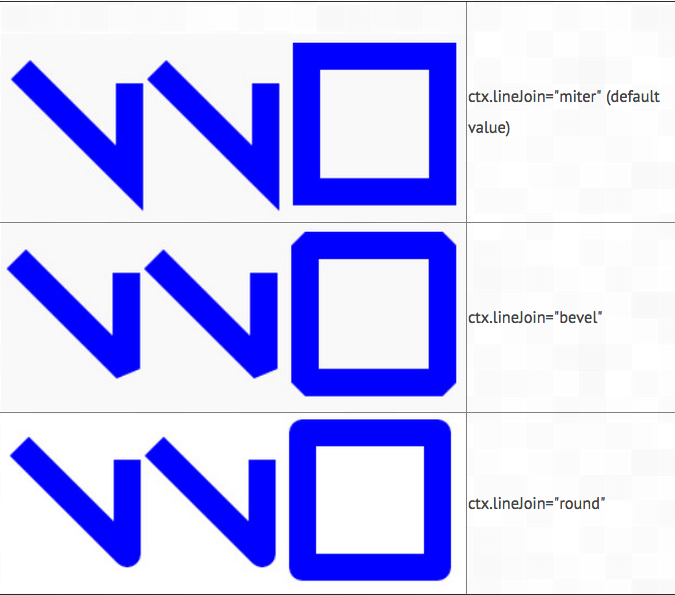
LINE STYLE: SETTING THE TYPE OF CORNER WHEN TWO LINES MEET
The lineJoin property of the context indicates the way corners are rendered, when two lines meet. Possible values are miter (the default) for creating sharp corners, round, or bevel for "cut corners".
Try the next example interactively: http://jsbin.com/dozida/2/edit
Source code:
- <!DOCTYPE html>
- <html>
- <head>
- <title>A simple example of lineJoin property use</title>
- </head>
- <body>
- <canvas id="myCanvas" width="500">Your browser does not support the canvas tag.</canvas>
- <script>
- var canvas = document.getElementById('myCanvas');
- var ctx = canvas.getContext('2d');
- // first path
- ctx.moveTo(20, 20);
- ctx.lineTo(100, 100);
- ctx.lineTo(100, 30);
- // second part of the path
- ctx.moveTo(120, 20);
- ctx.lineTo(200, 100);
- ctx.lineTo(200, 30);
- // indicate stroke color + draw first part of the path
- ctx.strokeStyle = "#0000FF";
- // Current line thickness is 20 pixels
- ctx.lineWidth = 20;
- // Try different values : miter(default), bevel, round
- ctx.lineJoin = "round";
- ctx.stroke();
- // Draws a rectangle
- ctx.strokeRect(230, 10, 100, 100);
- </script>
- </body>
- </html>
LINE STYLE: SPECIFIC CASE OF LINEJOIN="MITER", THE MITERLIMIT PROPERTY, A WAY TO AVOID LOOOOOOONG CORNERS!
The miterLimit property value corresponds to the maximum miter length: the distance between the inner corner and the outer corner where two lines meet. When the angle of a corner between two lines gets smaller, the miter length grows and can become too long.
In order to avoid this situation, we can set the miterLimit property of the context to a threshold value. If the miter length exceeds the miterLimit value, then the corner will be rendered as if the lineJoin property had been set to "bevel" and the corner will be "cut".
You can try an interactive example here: http://jsbin.com/bokusa/3/edit
In the example, try different values for the miterLimit property. You'll see that the way the corners are rendered changes at values around 2 and 3.
Source code:
- <!DOCTYPE html>
- <html>
- <head>
- <title>A simple example of miterLimit property use</title>
- </head>
- <body>
- <canvas id="myCanvas" width="500">Your browser does not support the canvas tag.</canvas>
- <script>
- var canvas = document.getElementById('myCanvas');
- var ctx = canvas.getContext('2d');
- // first path
- ctx.moveTo(20, 20);
- ctx.lineTo(100, 100);
- ctx.lineTo(100, 30);
- // second part of the path
- ctx.moveTo(120, 20);
- ctx.lineTo(200, 100);
- ctx.lineTo(200, 30);
- // indicate stroke color + draw first part of the path
- ctx.strokeStyle = "#0000FF";
- // Current line thickness is 20 pixels
- ctx.lineWidth = 20;
- // Try different values : miter(default), bevel, round
- ctx.lineJoin = "miter";
- // try to change this value, try 2, 3, 4, 5 et...
- ctx.miterLimit = 1;
- ctx.stroke();
- // Draws a rectangle
- ctx.strokeRect(230, 10, 100, 100);
- </script>
- </body>
- </html>
No comments:
Post a Comment